Changes in ESR signal line-shape of solution sample due to deoxygenation, etc.
ER240001E
Effect of dissolved oxygen in solution sample on ESR signal
The ESR signal of a solution sample may exhibit a wider linewidth than predicted from the structural formula. One of the factors contributing to this is the presence of dissolved oxygen in the solvent. Organic solvent placed in the air at room temperature may contain unintended dissolved oxygen, which can cause broadening due to its paramagnetic properties. For example, when there is a large amount of dissolved oxygen, such as in solution A, the ESR signal linewidth becomes wider as they become into contact with oxygen more frequently. This effect is attributed to the magnetic interaction between the unpaired spins of the paramagnetic material and the oxygen. Conversely, when there is a small amount of dissolved oxygen, as in solution B, the ESR signal is close to its intrinsic linewidth, as they become into contact with oxygen less frequently. Consequently, it may be possible to observe the hyperfine structure buried in the line-width by degassing the sample and removing the dissolved oxygen.
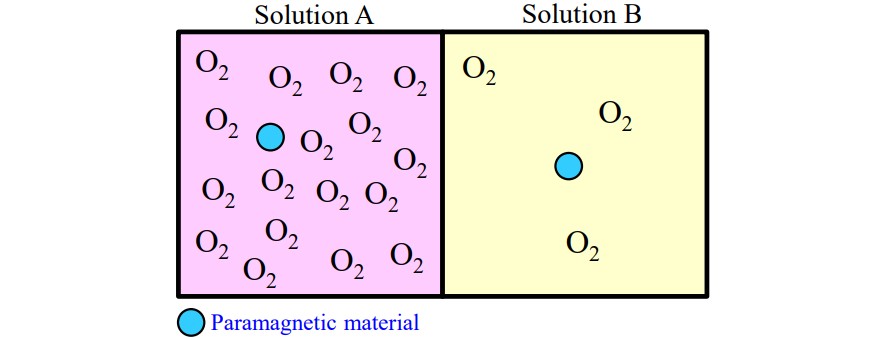
Figure1. Difference in dissolved oxygen concentrations in solution.
ESR signal of solution sample before deoxygenation
We present a measurement example of a sample in which the Galvinoxyl free radical is dissolved in benzene. The signal shown in Figure 2 was observed when the sample was measured at room temperature without degassing.
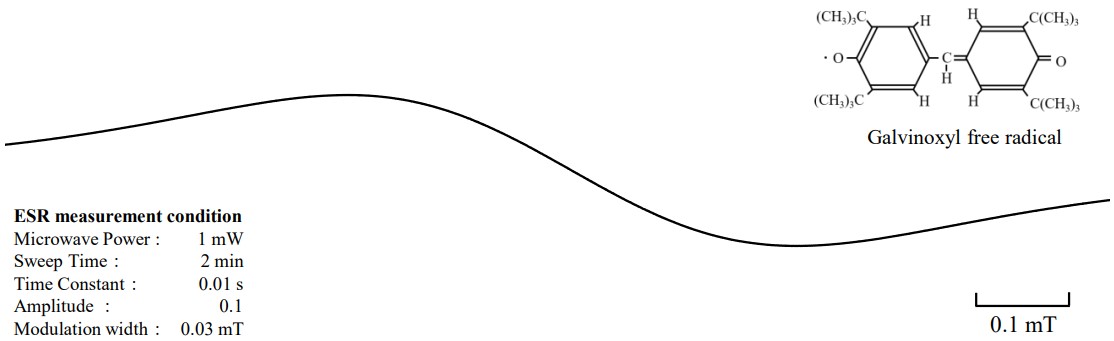
Figure 2. ESR signal line-shape before deoxygenation.
Theoretically, the ESR signal of this sample is expected to have 370 lines (2×5×37=370) due to hyperfine coupling of one methine hydrogen, four ring hydrogens, and 36 t-butyl hydrogens.
ESR signal of solution sample after deoxygenation
When the sample is degassed to remove oxygen from the solvent, the hyperfine splitting due to one methine hydrogen (AH = 0.595 mT) and four ring hydrogens(AH = 0.137 mT) becomes clear, as shown in Figure 3(A). It is possible to observe the hyperfine splitting of the 36 t-butyl hydrogens(AH = 0.0047 mT) by careful adjustment of the radical concentration and measurement conditions, in addition to vacuum degassing of the sample (Figure 3(B) and 3(C)).
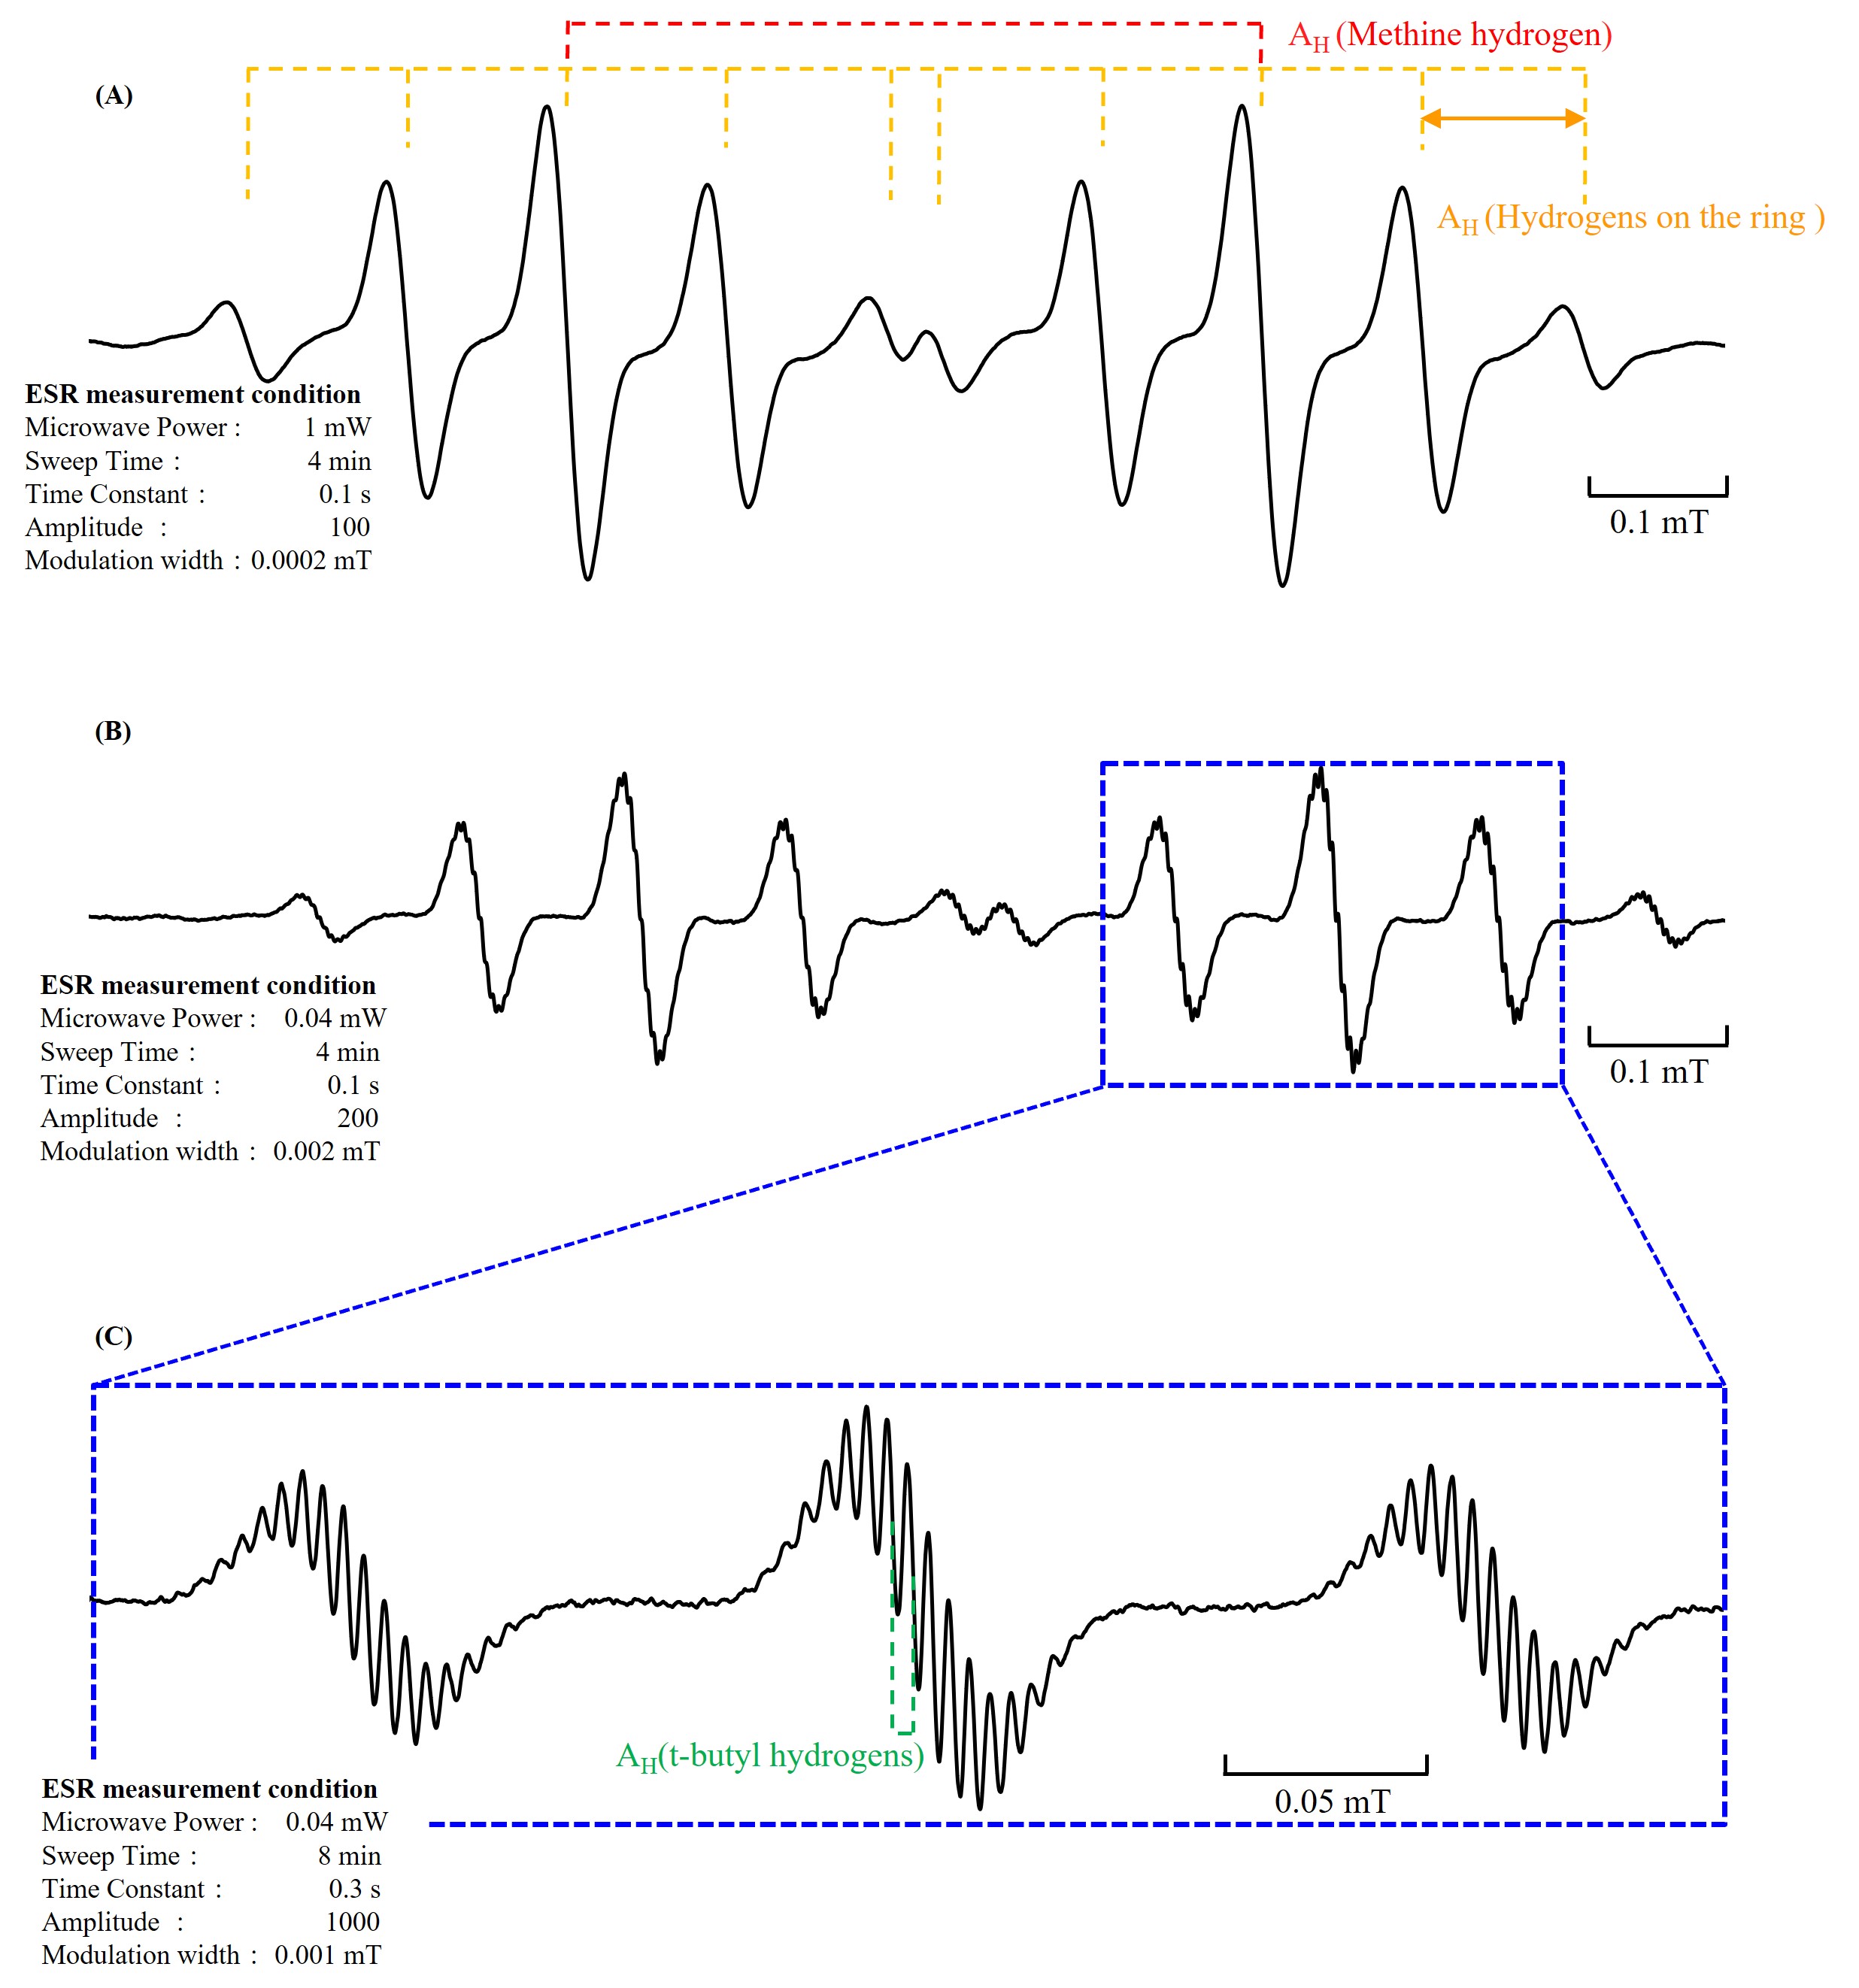
Figure 3. Change in ESR signal line-shape due to deoxygenation.
Solutions by field
Electrical / Electronic Component
Related products
Are you a medical professional or personnel engaged in medical care?
No
Please be reminded that these pages are not intended to provide the general public with information about the products.