Workflow for Elucidating Complex Molecular Structures by using XtaLAB Synergy-ED and JEOL MS and NMR,
part 2 : Quantum Mechanical Spectral Analysis (QMSA)
ED2023-02E
Elucidate the best fit three-dimensional molecular structure using MS, NMR and XtaLaB Synergy-ED data
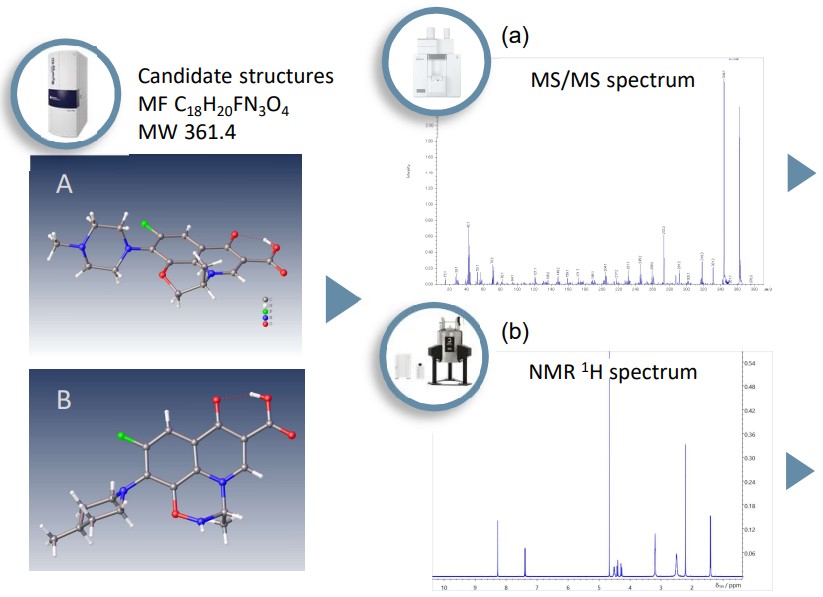
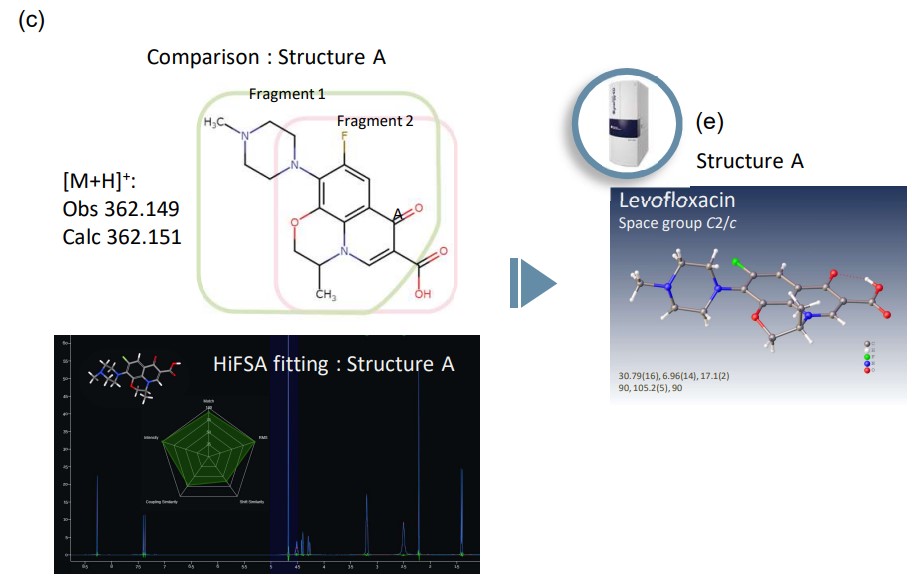
Figure 1. Workflow for analyzing the three-dimensional molecular structure of Levofloxacin. (a) MS/MS spectrum was measured using the JMS-S3000 SpiralTOF™-plus 2.0. (b) 1H NMR spectrum was measured using the JNM-ECZL 500R. (c) Results of MS analysis and CT HiFSA fitting of structure A. (d) Crystal structure was obtained from the electron diffraction structure analysis using XtaLAB Synergy-ED.
XtaLAB Synergy-ED allows molecular structure analysis of submicron particles of laboratory chemicals, pharmaceutical raw materials and so on. Furthermore, the comprehensive analysis with the JEOL mass spectrometer (MS) and nuclear magnetic resonance (NMR) spectrometer provides details of the chemical structure information for molecular structure determination. Figure 1 shows a workflow for the three-dimensional molecular structure analysis of Levofloxacin. This workflow provides the identification of the optimum structure of the experimental MS, NMR, and XtaLAB Synergy-ED data. In addition, it is possible to evaluate the consistency of the estimated structures by using the correlation between the experimental 1H NMR spectrum and the calculated 1H NMR spectrum of candidate structures. In the following, this application note explains the structure analysis workflow by using Quantum Mechanical Spectral Analysis (QMSA) including 1H iterative Full Spin Analysis (HiFSA) performed by Cosmic Truth (CT) software.1,2
CT HiFSA fitting : Levofloxacin
Figure 2. CT HiFSA fitting of Levofloxacin. Evaluation of the consistency between the experimental 1H NMR spectra and the calculated 1H NMR spectra of candidate structures using CT HiFSA. (a) 0-10 ppm (b) H1 signal, blue : the experimental spectrum, red : the calculated spectrum (c) H2 signal (d) Results of consistency analysis.
Figure 2 shows the results of CT HiFSA fitting of Levofloxacin. In Figure 2, we assessed the estimated structures obtained from the electron diffraction analysis. The correlation between the experimental 1H NMR spectra and the CT HiFSA spectra of candidate structures can be used to evaluate the consistency of estimated structures. The CT performs QMSA extracting the essential NMR signal parameters such as chemical shifts and coupling constants to evaluate the consistency between the experimental NMR data and the estimated molecular structure. In Figure 2 (b) and (c), the CT HiFSA result of candidate structure A was consistent with the experimental 1H NMR spectrum. Finally, the CT provides a measure of chemical shifts similarity, coupling constants similarity, intensity similarity, RMS score and Match score (Figure 2(d)). The Match score describes the relation between the parameters extracted from the experimental NMR data and their reference. The intensity similarity describes how much of the experimental intensity is explained by the calculated spectrum, therefore the QM-method also facilitates quantitation and purity analysis at the same time. In Figure 2(d), the result of candidate structure A showed good consistency, whereas structure B showed a poor consistency.
MS-CT HiFSA fitting and XtaLAB Synergy-ED : Cinchonidine
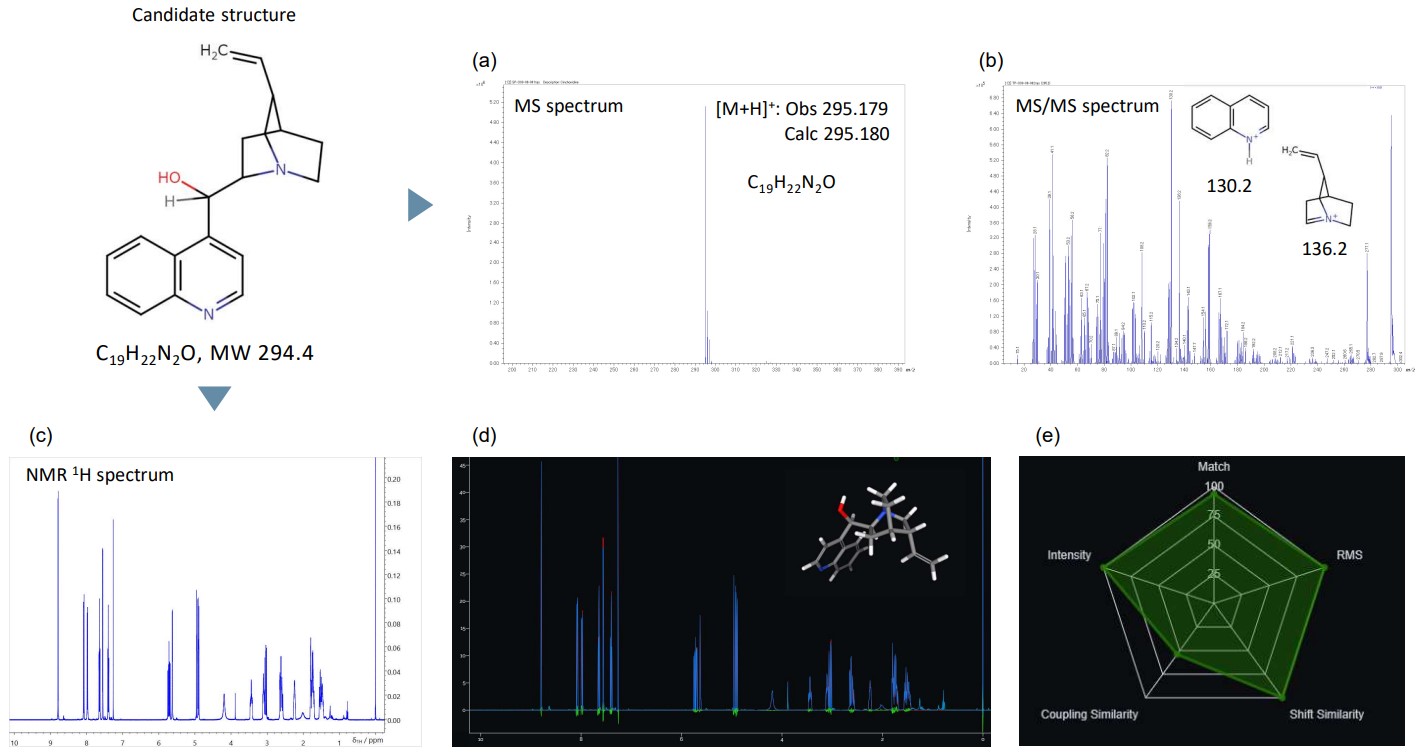
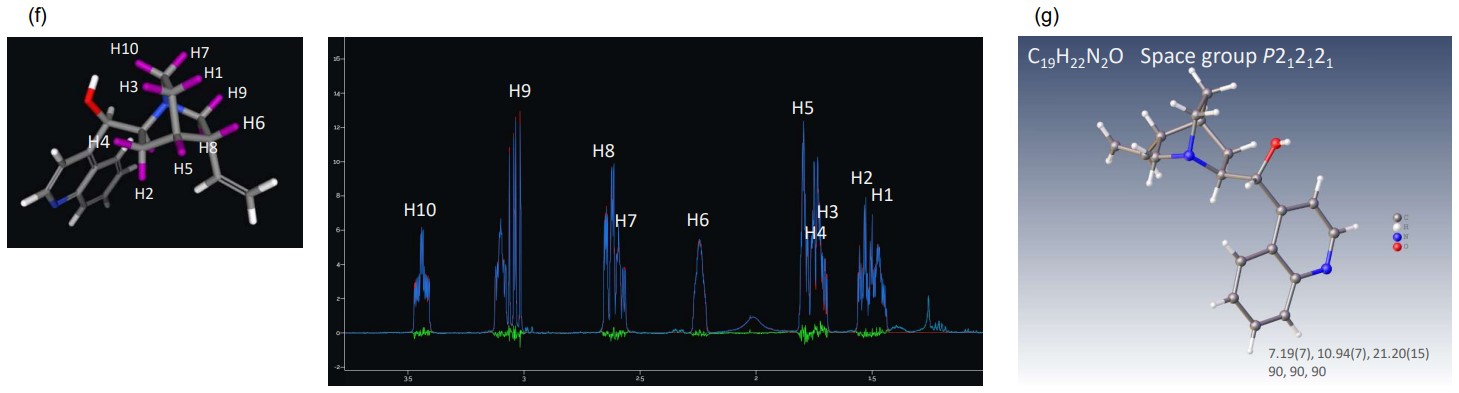
Figure 3. Workflow for analyzing the three-dimensional molecular structure of Cinchonidine. (a) MS spectrum and (b) MS/MS spectrum were measured using the JMS-S3000 SpiralTOF™-plus 2.0. (c) 1H NMR spectrum was measured using the JNM-ECZL 500R. (d) Result of CT HiFSA fitting. (e) Result of consistency analysis. (f) CT HiFSA fitting data of the partial structure of Cinchonidine. (g) Crystal structure was obtained from the electron diffraction structure analysis using XtaLAB Synergy-ED.
Figure 3 shows the results of the comprehensive analysis of Cinchonidine powder, obtained from MALDI-TOFMS (matrix-assisted laser desorption/ionization time-of-flight mass spectrometry) using the JMS-S3000 SpiralTOF™-plus 2.0, NMR analysis using the JNM-ECZL 500R and electron diffraction analysis using XtaLAB Synergy-ED. For elucidating the molecular structure, the molecular formula and the partial structures are estimated from the Mass spectrum (Figure 3(a)) and the MS/MS spectrum (Figure 3(b)). Then the result of MALDI-TOFMS is evaluated complementarily with the consistency analysis by using CT HiFSA (Figure 3(d) and (e)). Figure 3(f) shows the CT HiFSA fitting result of the complicated signal splitting corresponding to the partial structure of Cinchonidine. In Figure 3(f), the result of CT HiFSA was consistent with the experimental 1H NMR spectrum. Furthermore, an initial structural model obtained from the electron diffraction analysis is refined using the MALDI-TOFMS and NMR results. Figure 3(g) shows the refined molecular structure elucidated from the comprehensive analysis of MALDI-TOFMS and NMR.
MS-CT HiFSA fitting and XtaLAB Synergy-ED : Reserpine and Rescinnamine
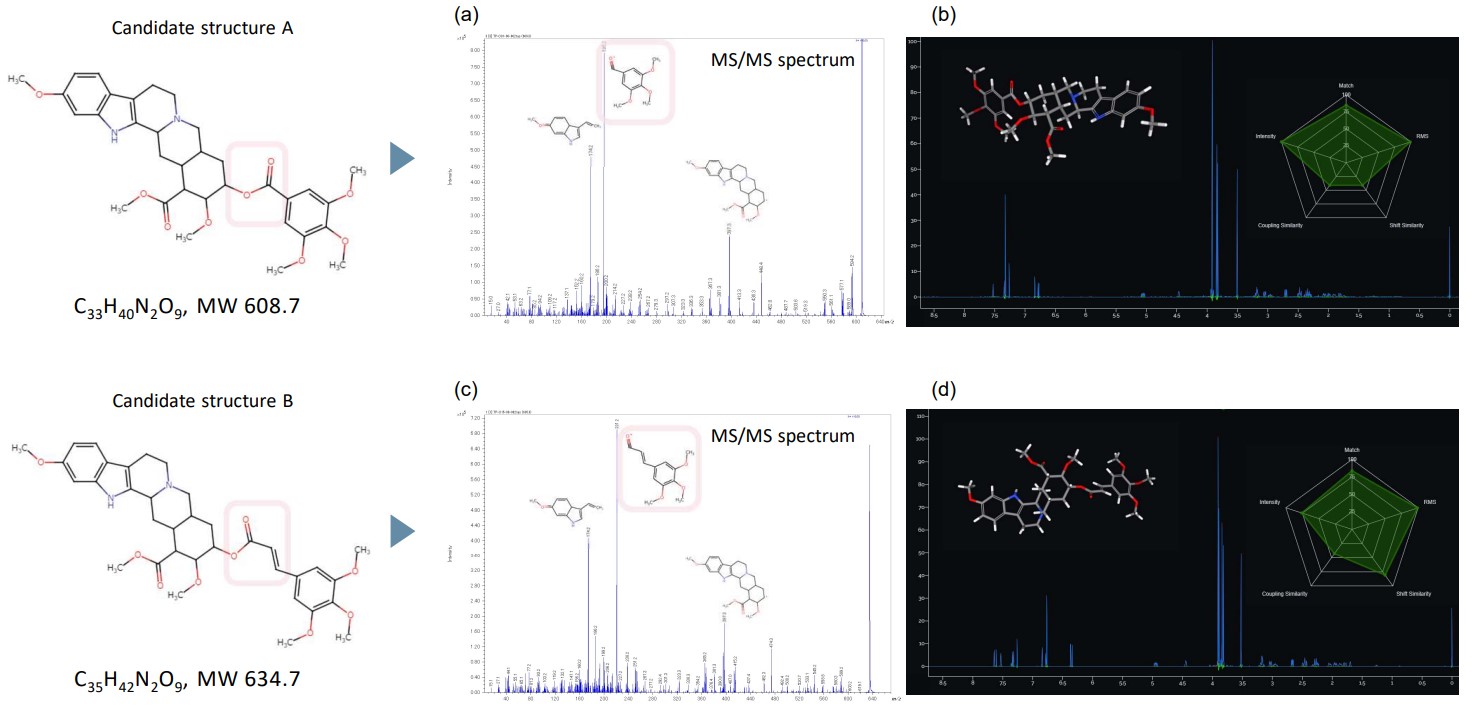
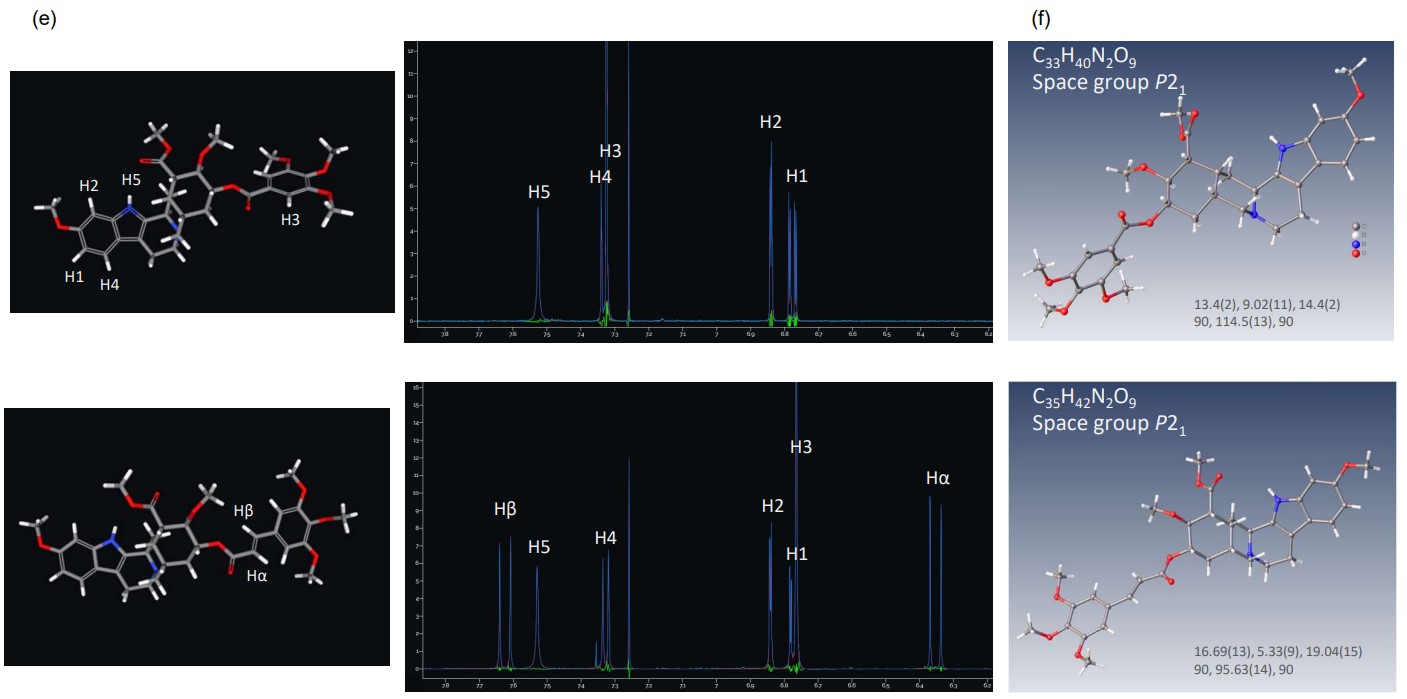
Figure 4. Workflow for analyzing the three-dimensional molecular structure of Reserpine and Rescinnamine. (a) MS/MS spectrum of Reserpine were measured using the JMS-S3000 SpiralTOF™-plus 2.0. (b) CT HiFSA fitting result of Reserpine. (c) MS/MS spectrum of Rescinnamine. (d) CT HiFSA fitting result of Rescinnamine. (e) CT HiFSA fitting result of 6.2-7.8 ppm. (f) Crystal structure was obtained from the electron diffraction structure analysis using XtaLAB Synergy-ED.
Figure 4 shows the results of the comprehensive analysis of Reserpine and Rescinnamine, obtained from MALDI-TOFMS, NMR analysis and electron diffraction analysis using XtaLAB Synergy-ED. The molecular formula and the partial structures are estimated from the Mass spectra and the MS/MS spectra (Figure 4(a) and (c)). Then the result of MALDI-TOFMS is evaluated complementarily with the consistency analysis by using CT HiFSA (Figure 4(b) and (d)). Figure 4(e) shows the CT HiFSA fitting results of the signal splitting corresponding to the partial structures of Reserpine and Rescinnamine. In Figure 4(e), the results of CT HiFSA were consistent with the experimental 1H NMR spectra of Reserpine and Rescinnamine, respectively. Furthermore, Figure 4(f) shows the refined molecular structures elucidated from the comprehensive analysis of MALDI-TOFMS and NMR.
References
(1) Pauli G. F., Chen S. N., Lankin D. C., Bisson J., Case R. J., Chadwick L. R., Gödecke T., Inui T., Krunic A., Jaki B. U., McAlpine J. B., Mo S.,
Napolitano J. G., Orjala J., Lehtivarjo J., Korhonen S. P., Niemitz M., J. Nat. Prod. 2014, 77, 6, 1473–1487.
(2) Cosmic Truth: https://ct.nmrsolutions.io/
Solutions by field
Related products
Are you a medical professional or personnel engaged in medical care?
No
Please be reminded that these pages are not intended to provide the general public with information about the products.