Delta Tips: Visualization of Arrayed Data
NMDT_0033
How to linearize arrayed data
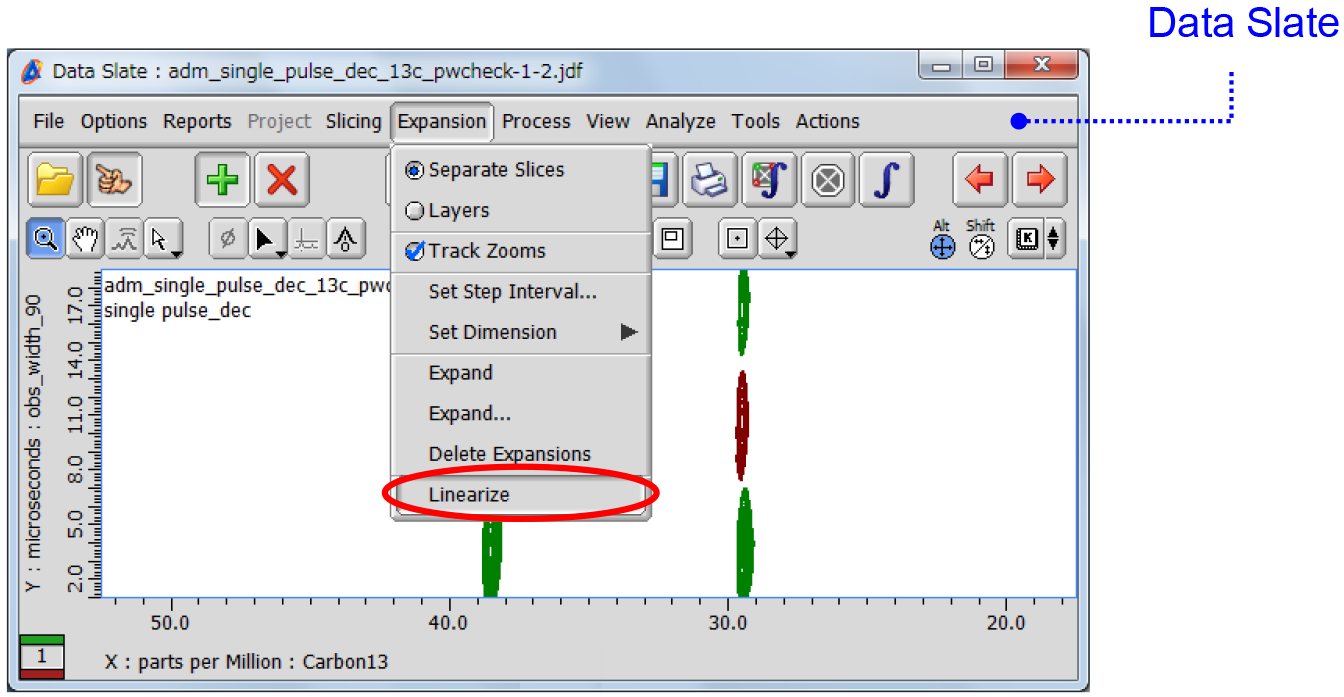
It is possible to open an arrayed data in Data Slate and to use the "Linearize" function in order to arrange all the 1D spectra side by side. This is useful if you measure pulse width or diffusion coefficient, for instance. In this example, we will show how to measure pulse width.
Select Expansion – Linearize.
∗ Refer to User’s Manual on how to collect arrayed data (i.e. pseudo 2D data) on JEOL NMR spectrometers. In this example, obs_width_90 was varied from 1 μs to 19 μs (step 0.5 μs). All the 1D spectra were stored as a single pseudo-2D data file.
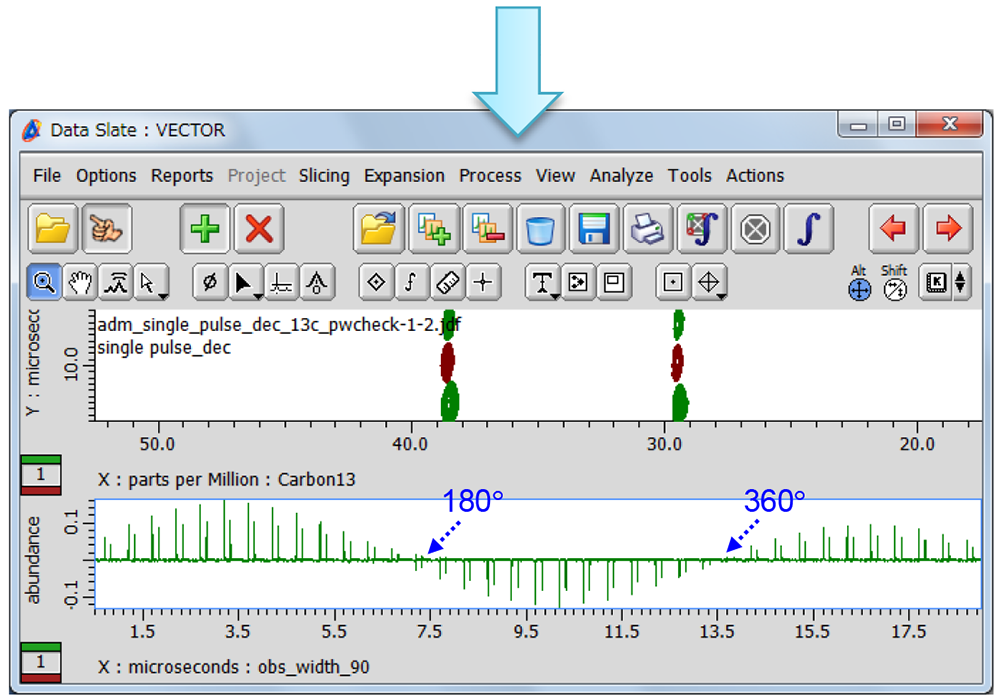
⇑ The plot of signal intensity vs. pulse width consists of 37 one-dimensional 13C spectra arranged side by side.
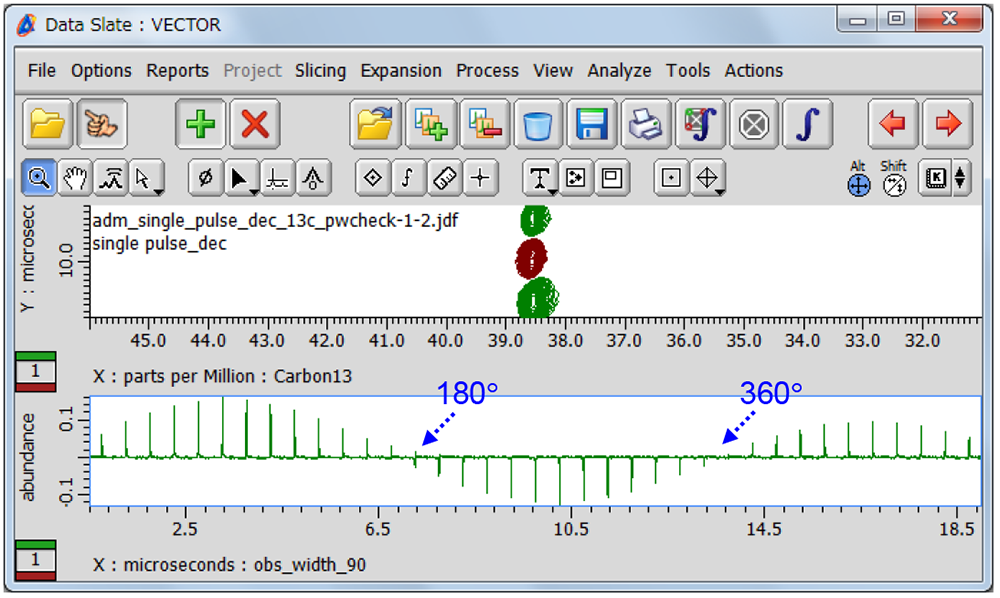
⇑ To simplify the plot, it might be convenient to zoom in on a specific peak (e.g. 38.6 ppm) rather than a group of peaks.
- If you want to see a printed version,
please click this PDF file. 
PDF 895KB
SEARCH APPLICATIONS
Related Products
Are you a medical professional or personnel engaged in medical care?
No
Please be reminded that these pages are not intended to provide the general public with information about the products.