Delta Tips: How to Report Diffusion Coefficient
NMDT_0017
This issue of Delta Tips demonstrates how to report diffusion coefficient (D) of multiple peaks at once.
① Click the button in the red circle to activate the selection mode in the Curve Analysis window. Select the peaks of interest to calculate and report their D values. We have selected two doublets.
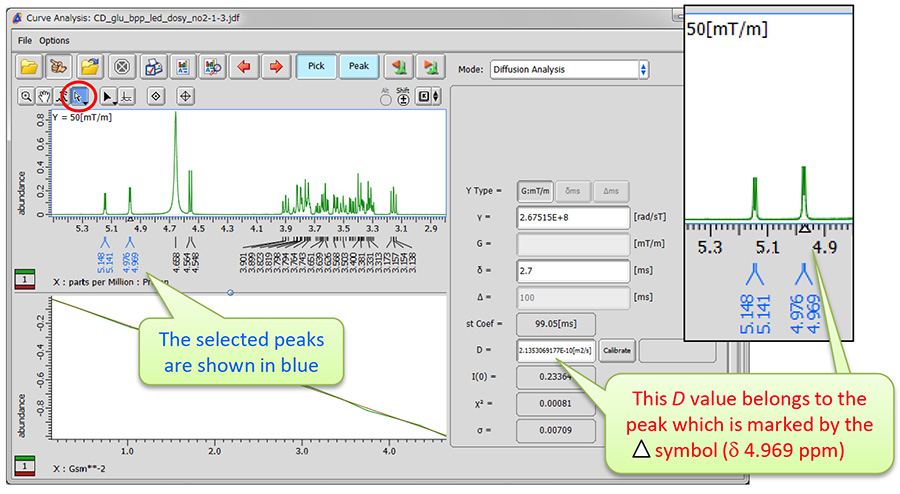
∗ If a group of peaks is selected, it is possible to switch from one peak to another one within the group by clicking the buttons shown below.

② Click the button in the Curve Analysis window to create a report. The Report Options window opens.
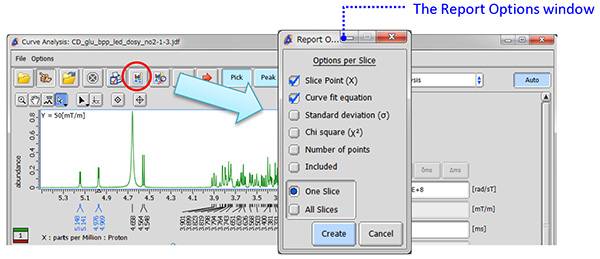
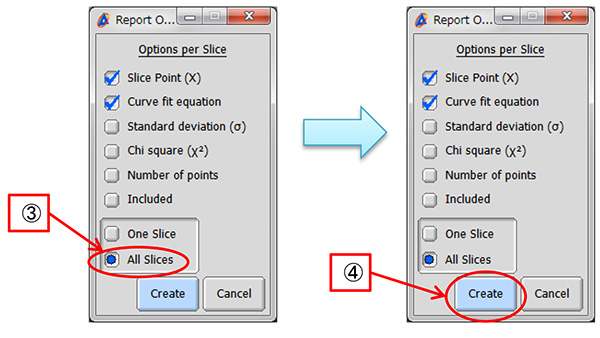
③ Select the ‘All Slices’ option in the Report Options window. The other check boxes allow you to customize content of report.
④ Click the [Create] button to create the report on all the peaks selected above.
⑤ Click the button in the red circle to view the report. The File Information tool opens and the Reports tab is automatically displayed.
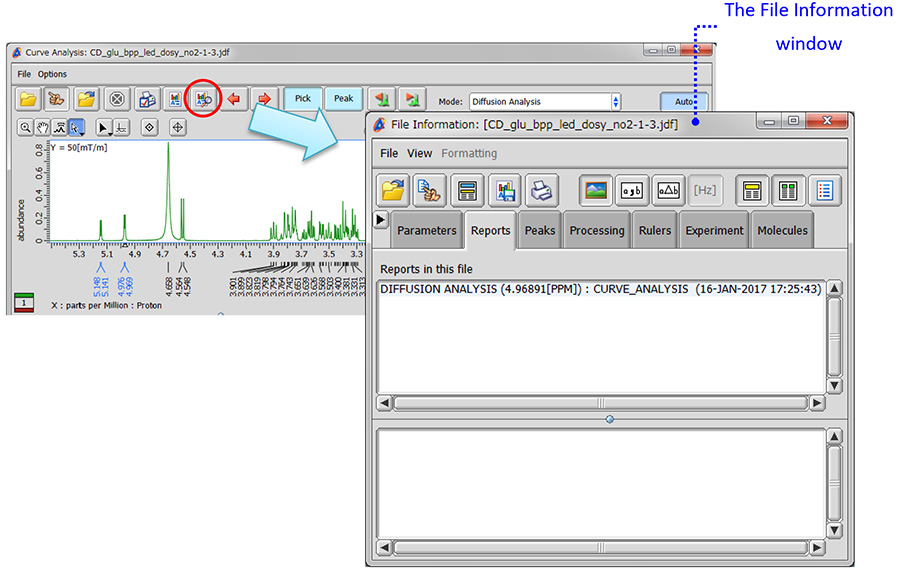
⑥ Select ‘CURVE_ANALYSIS’ to display the report.
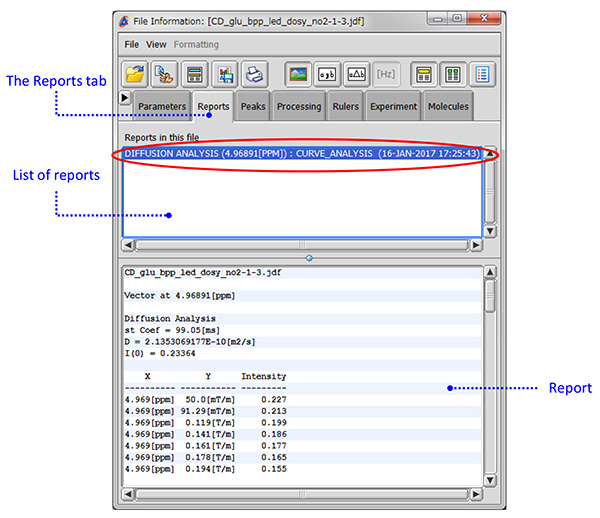
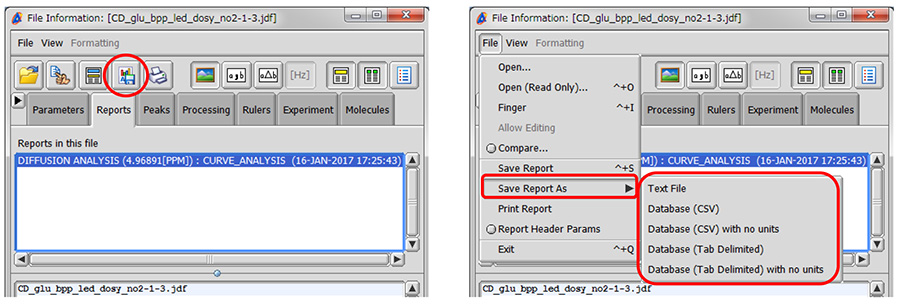
⑦ Save the report in a file as shown below.
∗ Click the button in the red circle to save the report on diffusion data as a text file (∗.txt).
∗ Select File – Save Report As to save the report as a text file (∗.txt), comma separated value file (∗.csv) or tab separated value file (∗.txt).
- If you want to see a printed version,
please click this PDF file. 
PDF 779KB
SEARCH APPLICATIONS
Related Products
Are you a medical professional or personnel engaged in medical care?
No
Please be reminded that these pages are not intended to provide the general public with information about the products.