Delta Tips: Data Slate (Part 1)
NMDT_0007
Drag & Drop function
1. How to load multiple spectra into one Data Slate.
The Drag & Drop function can be used to display multiple spectra in a single Data Slate window. Depending on how you perform the Drag & Drop operation, the spectra are either displayed individually in two separate geometries (Method A) or overlaid in a single geometry (Method B). Follow the figures shown below.
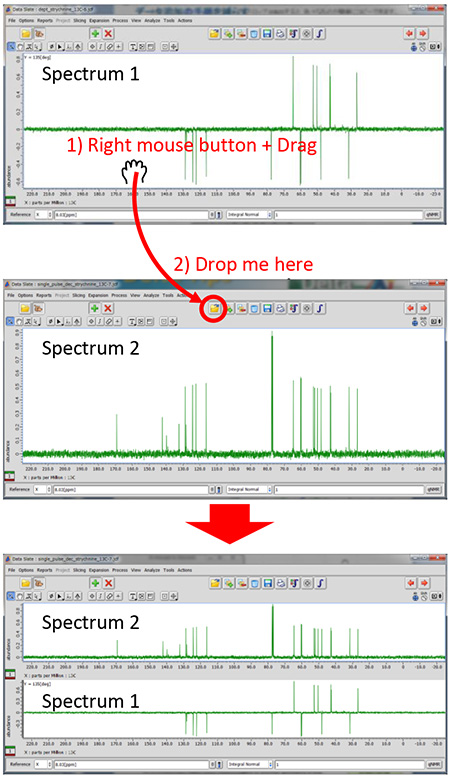
In this method, Spectrum 1 has been dropped over the button in the red circle. As a result, the two spectra are tiled in one Data Slate window.
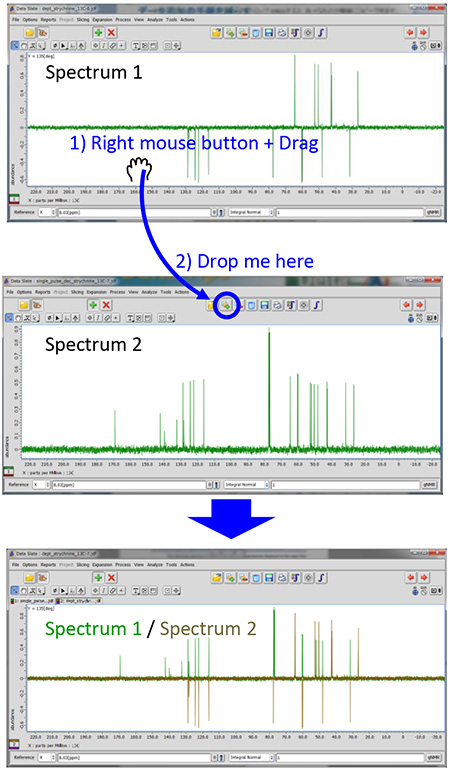
In this method, Spectrum 1 has been dropped over the button in the blue circle. As a result, the two spectra are overlaid in one Data Slate window.
2. How to zoom two spectra identically.
The Drag & Drop function can be used to expand a spectrum in accordance with another one. First of all, click the button in the purple circle to activate the Zoom mode in the template spectrum. Spectrum 1 is the template in the example shown below. Next, push the right-mouse-button inside the area of Spectrum 1 and drag it to Spectrum 2. Release the right-mouse-button when the cursor is inside the area of Spectrum 2.
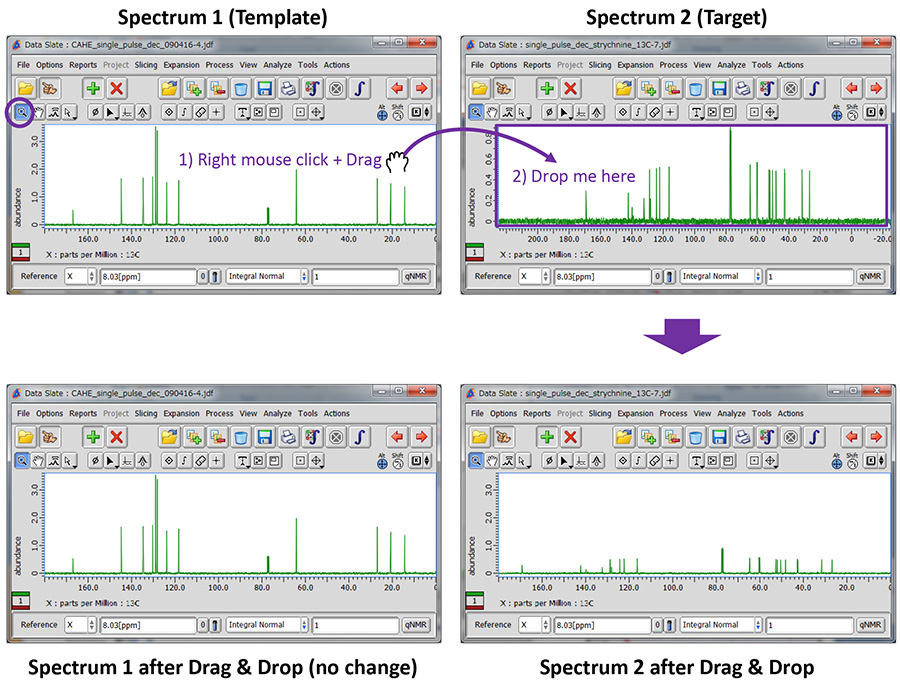
This method allows you to synchronize view ranges, including chemical shift range and intensity range, in two Data Slates. This is convenient if you wish to compare signal intensities, number of signals or chemical shifts between two spectra.
- If you want to see a printed version,
please click this PDF file. 
PDF 735KB
SEARCH APPLICATIONS
Related Products
Are you a medical professional or personnel engaged in medical care?
No
Please be reminded that these pages are not intended to provide the general public with information about the products.