Let's use a chemical shift prediction tool in JASON! Confirmation of analysis results by chemical shift prediction (2)
NM220019E
The results of structural analysis by NMR should be judged based on consistency with various measurement data. In recent years, there has been remarkable development in software-based chemical shift prediction. By comparison of actual chemical shift values with chemical shift prediction, it's possible to improve the accuracy of analysis. Here, we report an example to use a chemical shift prediction tool in JASON*.
(JASON: JEOL Analytical Software Network)
Judgement of an estimated structure by chemical shift values
Here is an example of analysis of a compound whose molecular formula is C15H10O4. In this compound, two estimated structures I and II were derived from measurements of 13C, DEPT, HSQC, COSY, HMBC and 1,1-ADEQUATE (Fig. 1). The difference is the position of an oxygen. Estimated structure I is ether and the oxygen is located between carbons K and I. On the other hand, estimated structure II is ester and the oxygen is located next to carbonyl carbon M. Therefore, we confirm the 13C chemical shift value of K. The 13C chemical shift value of benzene is 128.5 ppm. It is known as an additive of substituent effects on 13C chemical shift values: when benzene is bonding to a substitution containing oxygen (e.g., hydroxyl and methoxy groups), its chemical shift value is shifted to a lower magnetic field region. The chemical shift value of K was observed as 157.9 ppm. Thus, K is bonding to oxygen and we can consider structure I is correct.
Confirmation of an estimated structure by a chemical shift prediction tool in JASON
With remarkable development in software-based chemical shift prediction, it can be used as the substitute of the knowledge of chemical shift additivity. The chemical shift prediction tool in JASON was applied to both estimated structures I and II (Fig. 2). Table. 1 shows the actual and predicted values of the chemical shifts. The predicted values of K and M in estimated structure II were about 20 ppm smaller than actual values. The predicted values of estimated structure I had good agreement with the actual values. Thus, we can be more confident that structure I is the correct structure.
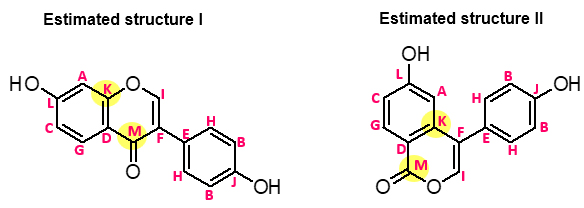
Fig. 1 Two estimated structures I and II
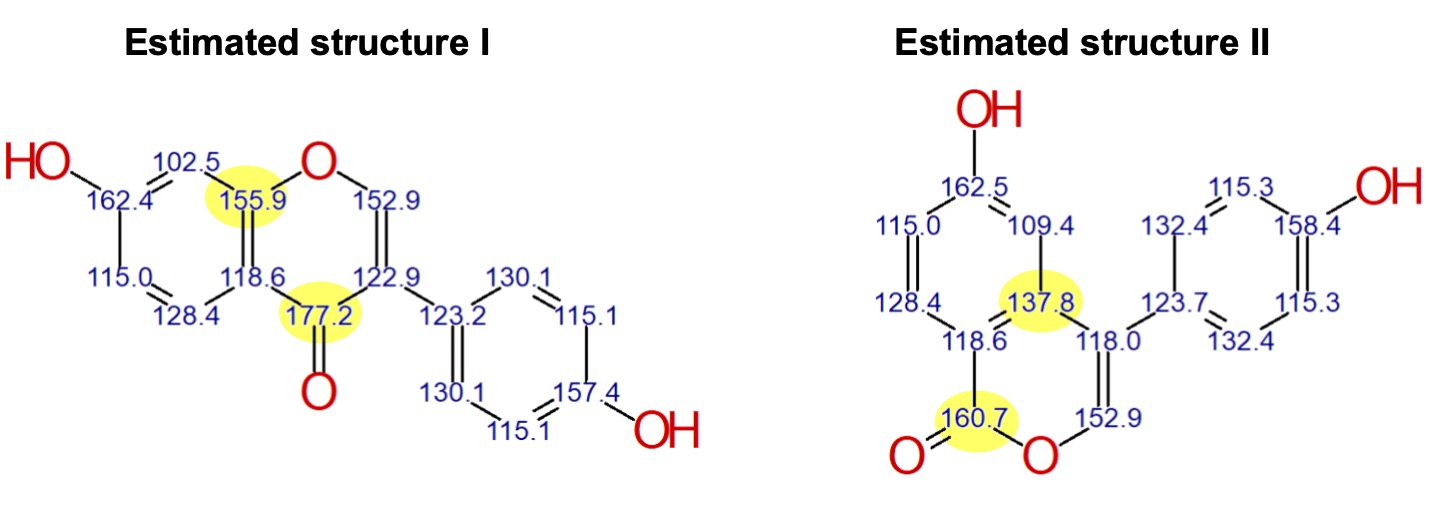
Fig. 2 Chemical shift prediction values
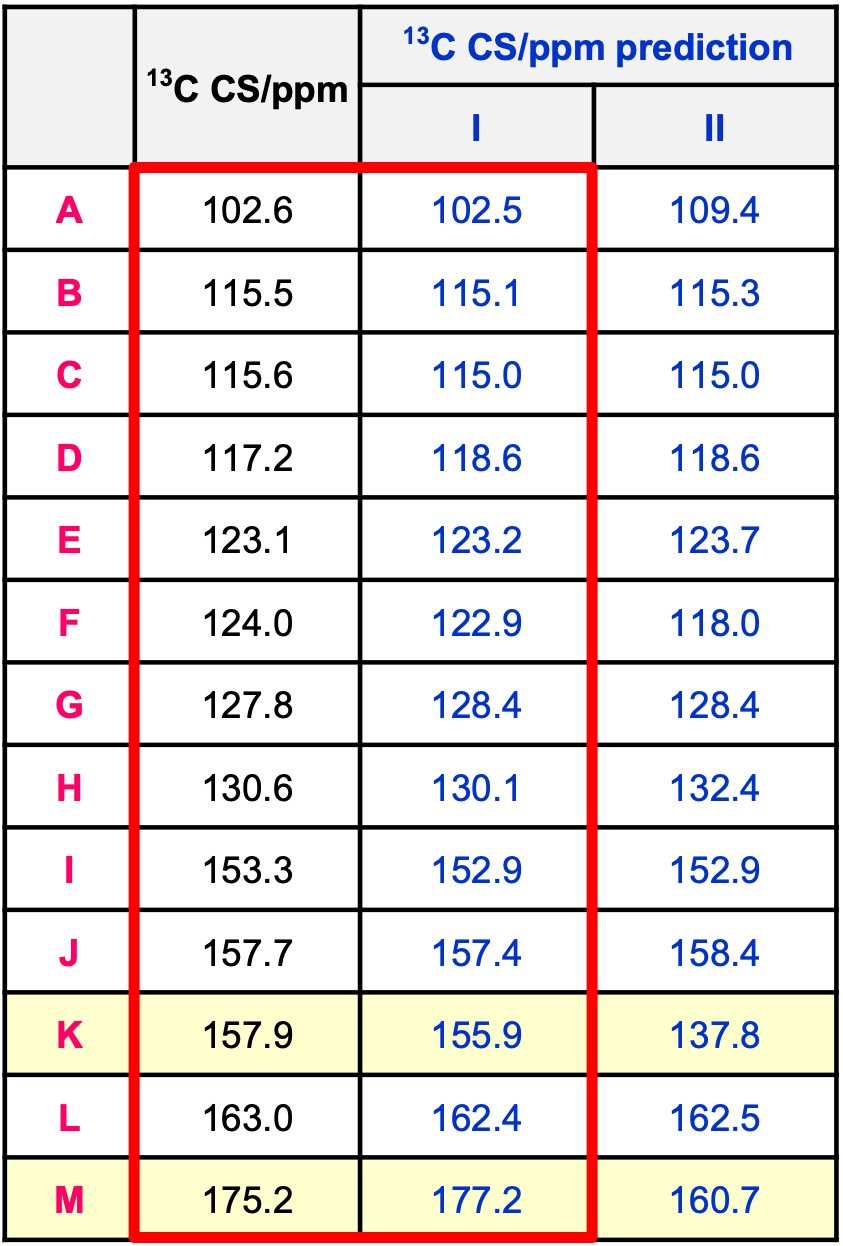
Table. 1 Comparison of actual chemical shift values with prediction values
Solutions by field
Related products
Are you a medical professional or personnel engaged in medical care?
No
Please be reminded that these pages are not intended to provide the general public with information about the products.