Application of T2-filter: Signal suppression for polymers
NM220002E
Application and Features
This technique is suitable for mixtures. The T2-filter suppresses broad signals of components with short T2 relaxation times such as polymers and biomacromolecules. While the signals of these high molecular weight components are suppressed, signals of small molecules can be selectively observed. For example, this technique is effective in the analysis of small molecule additives added to polymeric materials, protein-ligand binding studies, and blood plasma analysis in metabolomics.
Principle of T2-filter
Fast decaying components in FID (Free Induction Decay) become broad signals in NMR spectrum after Fourier Transform. In general, 1H signals of polymers and signals of exchangeable protons, such as OH and NH protons, tend to be broad (Fig. 1a). On the other hand, FID signals of highly mobile small molecules decay slowly and become sharp signals in NMR spectrum after Fourier transform (Fig. 1b). The fast decaying components have short T2 relation times, whilst the slowly decaying components have long T2 times. To make benefit of different T2 relaxation properties, the T2-filter is applied at the very beginning of the pulse sequence and then acquisition of NMR signal follows. Under the conditions shown in Fig. 2, the acquisition starts after the fast-decaying signals have decayed. As a result, the broad signals are suppressed, whilst the narrow signals are observed.
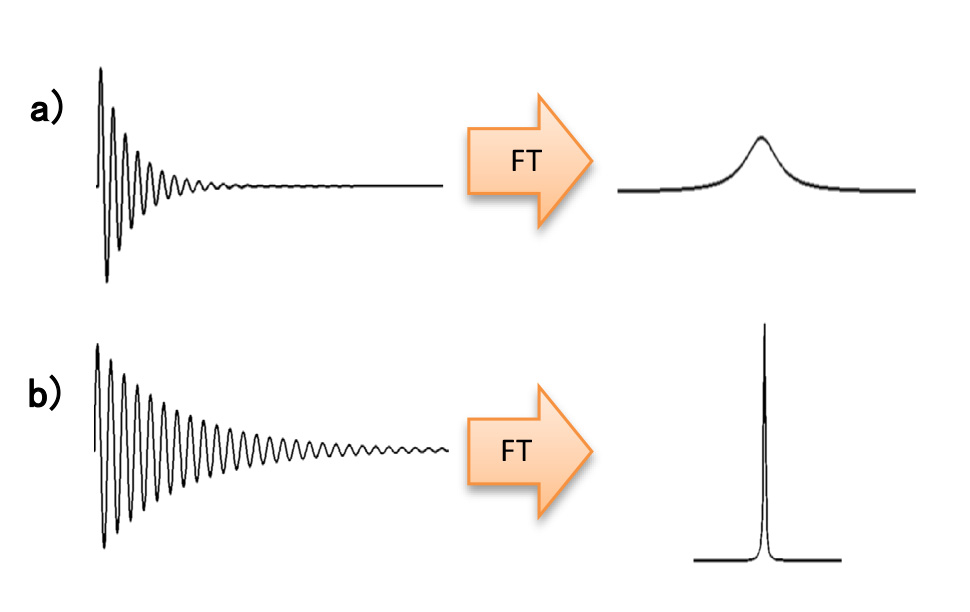
Fig. 1: Decay time and line width of a) fast decaying signals, and b) slow decaying signals
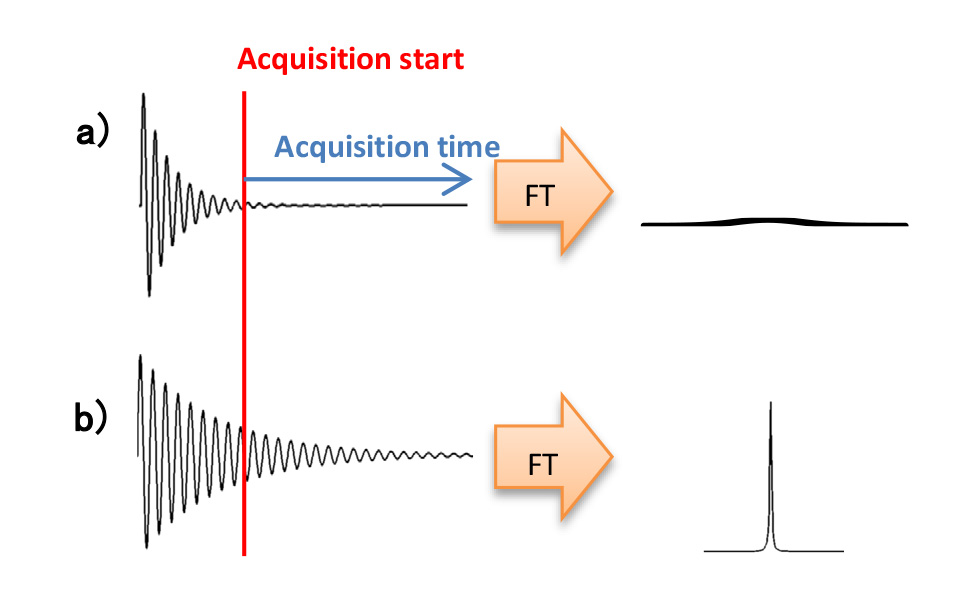
Fig. 2: Effect of T2-filter on a) fast decaying signals, and b) slow decaying signals
For example, the experiments used for T2 measurements are the CPMG (Carr-Purcell-Meiboom-Gill) and PROJECT (Periodic Refocusing of J Evolution by Coherence Transfer) experiments. The same experiments can be used for T2-filtering. Here we demonstrate T2-filtering on a sample of Styrofoam. Fig. 3 shows comparison of (a) standard and (b) T2-filtered 1H spectra. The T2-filter reduces the broad components (mainly polystyrene) very efficiently in Fig. 3b, and hence the sharp signals previously invisible become visible.
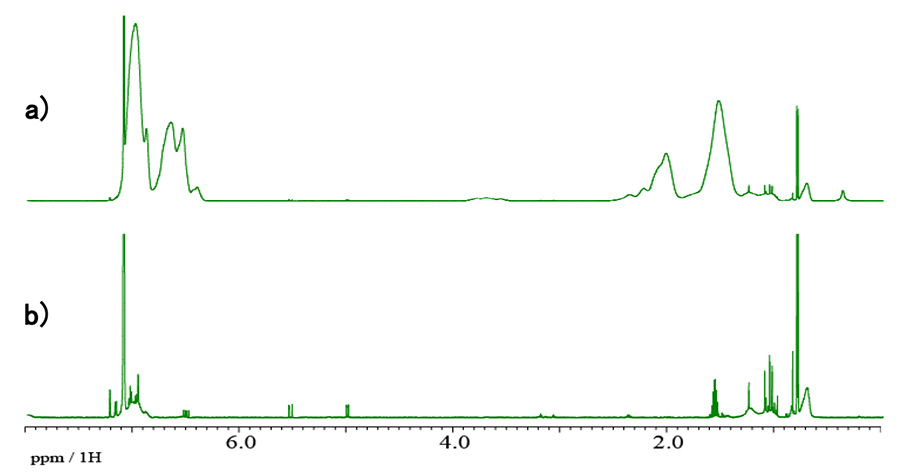
Fig. 3: Comparison of a) 1H standard spectrum, and b) T2-filter.
Parameters of T2-filter
Experiment: cpmg_project.jxp
Scans: 32
Delay_list: 2.5 [s]
Tau_step: 10 [ms]
- Please see the PDF file for the additional information.
Another window opens when you click. 
PDF 346.0 KB
SEARCH APPLICATIONS
Related Products
Solutions by field
Are you a medical professional or personnel engaged in medical care?
No
Please be reminded that these pages are not intended to provide the general public with information about the products.