Application of diffusion filter - suppression of signal of small molecule
NM220001E
Application and Features
This is a technique for mixtures. The diffusion filter is applied to reduce signals of components with large diffusion coefficients, such as solvents and small molecules, while signals of components with small diffusion coefficients, such as polymers, are affected to much lesser level. This technique can be used as a solvent suppression method for solvents with large diffusion coefficients. Unlike other solvent suppression techniques, this method differentiates signals based on differences in physical properties. Since this technique does not rely on selective excitation, the signals of polymers overlapped with the signal of solvent can be observed.
Measurement
Parameters can be set in the same manner as they are set in conventional diffusion experiments. However, since only one 1D spectrum needs to be measured instead of pseudo-2D data set, the measurement time is almost the same as that for ordinary 1H NMR spectrum. For example, Fig. 1 shows the relationship between magnetic field gradient strength and 1H signal intensity for molecules with large and small diffusion coefficients. The red line indicates a component with a large diffusion coefficient (i.e. small molecule), whilst the blue line indicates a component with a small diffusion coefficient (i.e. large molecule). The dashed line indicates that at the magnetic field gradient strength G of 0.3 T/m, the blue component is greatly suppressed, while the red component is almost unaffected. This point represents suitable experimental condition for selective observation of the red component.
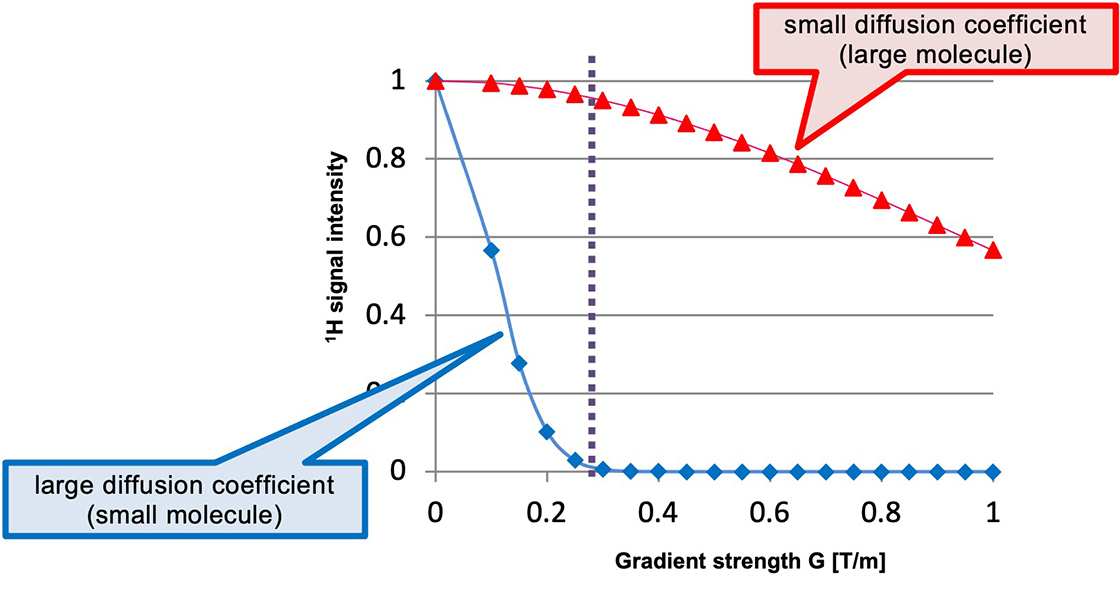
Fig. 1: Relationship of magnetic field gradient strength and 1H signal intensity
Here, we will demonstrate the effect of diffusion filter on an undiluted solution of hand soap. The 1H spectrum of this sample is shown in Fig. 2.
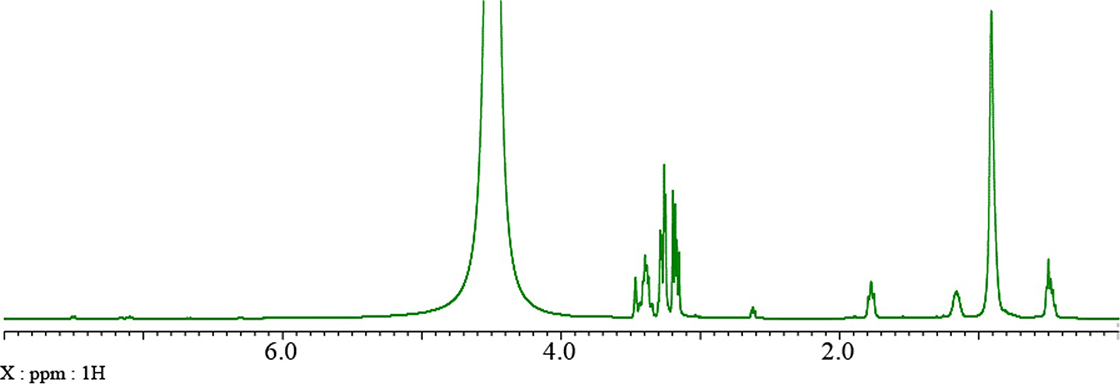
Fig. 2: 1H spectrum of hand soap
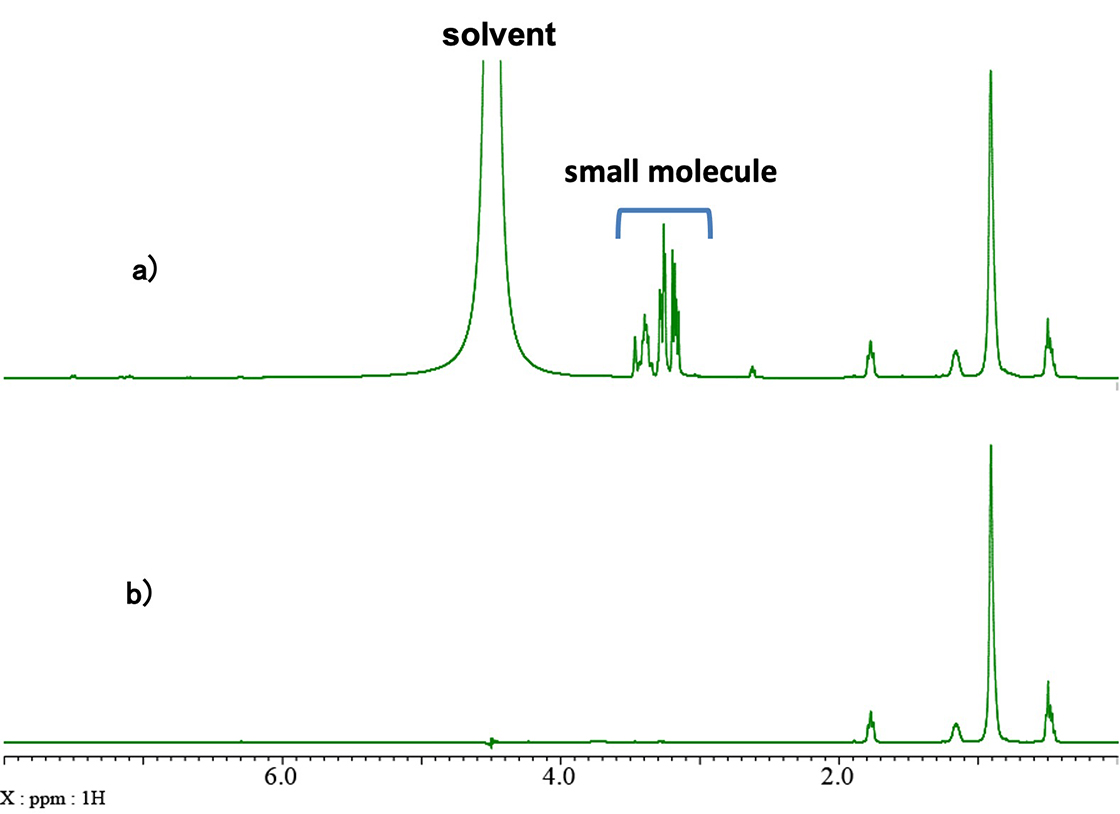
Fig. 3 shows a comparison of the 1H spectrum (a) and the spectrum collected with diffusion filter (b). The signals in the 1-2 ppm range are observed in both spectra, but the signals in the 2-5 ppm range are not visible in the spectrum with diffusion filter. Therefore, the signals between 2 ppm and 5 ppm can be attributed to a small molecule and the solvent (water).
Parameters of diffusion filter
bpp_ste_led_diffusion.jxp
diffusion time: 0.18 [T/m]
delta: 4 [ms]
g: 0.28 [T/m]
Fig. 3: Comparison of a) 1H spectrum, and b) Diffusion filter
Fig. 4 shows a comparison of 1H spectra (a), presaturation (b) and diffusion filter (c). Presaturation suppresses the signal of water at around 4.5 ppm. However, it also suppress the small signals at around 3.7 and 4.2 ppm indicated with red circles in the spectrum collected with diffusion filter.
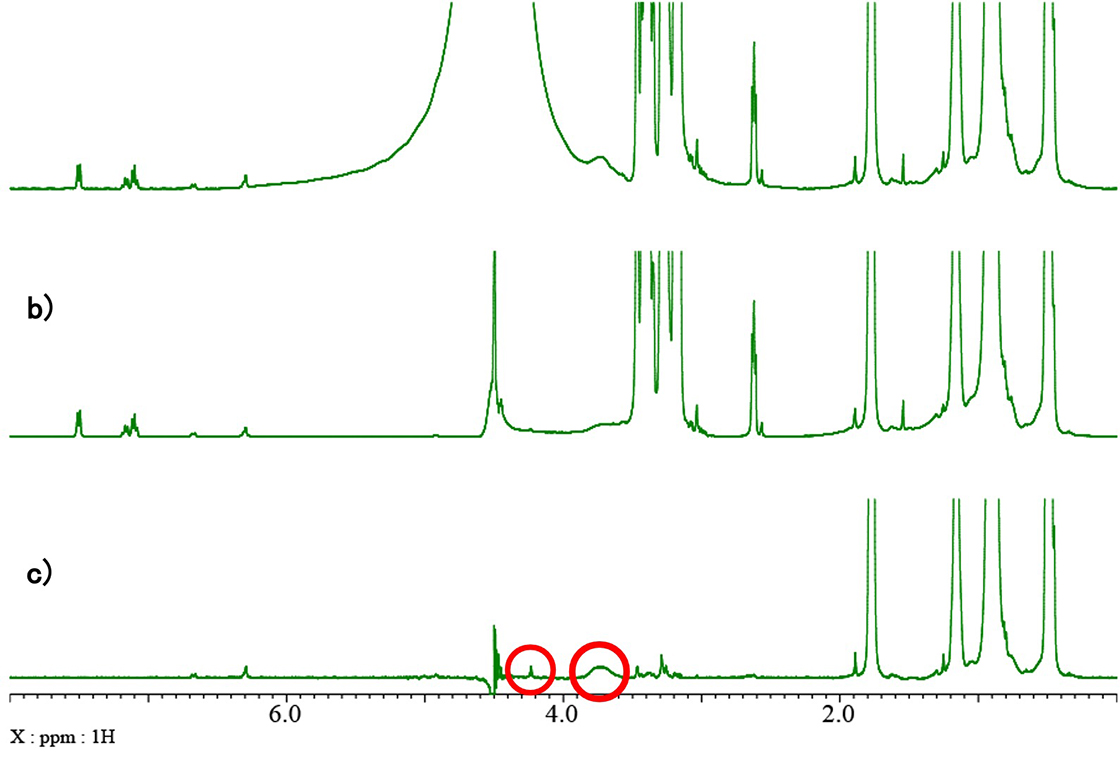
Fig. 4: Comparison of a) 1H spectrum, b) presaturation, and c) diffusion filter
- Please see the PDF file for the additional information.
Another window opens when you click. 
PDF 990 KB
Related Products
Solutions by field
Are you a medical professional or personnel engaged in medical care?
No
Please be reminded that these pages are not intended to provide the general public with information about the products.