The NMR application for medicinal screening
NM170019
The merit of the observation of protein – ligand※1 interaction by NMR is that one can observe interaction at equilibrium state between association and dissociation in solution. 1D NMR techniques are useful methods that can be used to reveal the target molecule among candidates of many small compounds.
In this context, they are attracting attention as screening※2 method s of pharmaceutical products.
※2 Screening is select those that show drug efficacy / activity from a large number of candidate compounds.
spin diffusion and saturation transfer
"Spin diffusion" and "Saturation transfer" are keywords in NMR techniques of protein-ligand interaction.
When certain protein signals are saturated , saturation is diffused to all protein signals. This phenomenon is called Spin diffusion.
Then the effect of diffusion is transferred to the ligand that binds the protein. This is called Saturation Transfer.
The signal intensities of saturated ligand are decreased (other signals are not changed). Schematic explanation of saturation transfer is shown in Fig 1. Saturation transfer is introduced by chemical exchange between protein-bound and protein-free ligand.
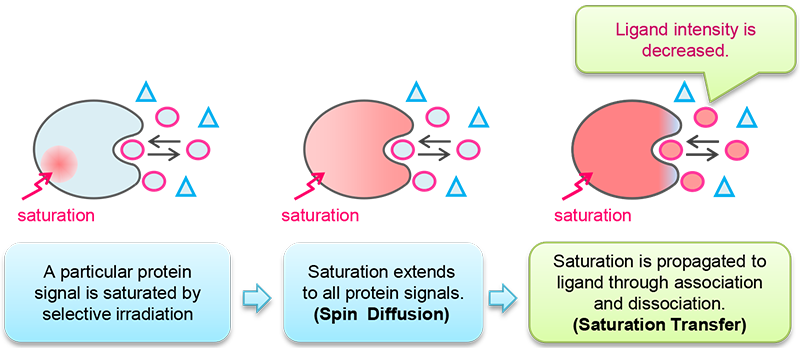
Fig 1: Explanation of saturation transfer
STD(Saturation Transfer Difference)
In STD experiment, one obtains the difference spectrum between a spectrum with saturation and a spectrum without saturation. As a result, signals that show no intensity change are canceled out and only binding ligand signals remain. In other words, STD spectrum shows only ligand signals with binding activity to protein. A schematic explanation of STD is shown in Fig 2. Red-colored area indicates saturation where signals are not observed or are observed with reduced intensity.
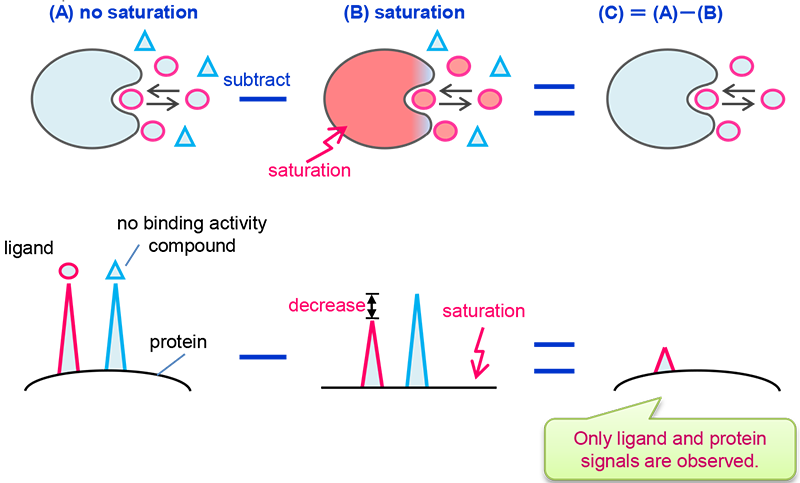
Fig 2: Explanation of STD
STD experiment
STD experiment produces a difference spectrum. The difference spectrum can be obtained by alternately collecting the excited spectrum and the non-excited spectrum in the same experiment. Moreover, protein signals are reduced by T1ρfilter to make analysis easier.(Fig 3)

Fig 3: The pulse sequence of STD experiment
Reference: J. Klein, R.Meinecke, M.Mayer, and B.Meyer, J. Am. Chem. Soc. 1999, 121, 5336-5337.
STD spectrum
Fig 4. shows the STD spectrum (A) and 1H spectrum (B) of mixture solution of Human Serum Albumin (HSA), L-(+)-Arginine (Arg) and L-Tryptophan (Trp).
In the STD spectrum, Tryptophan signals which have binding activity to Albumin can be observed, while Arginine signals which have no binding activity are not present.
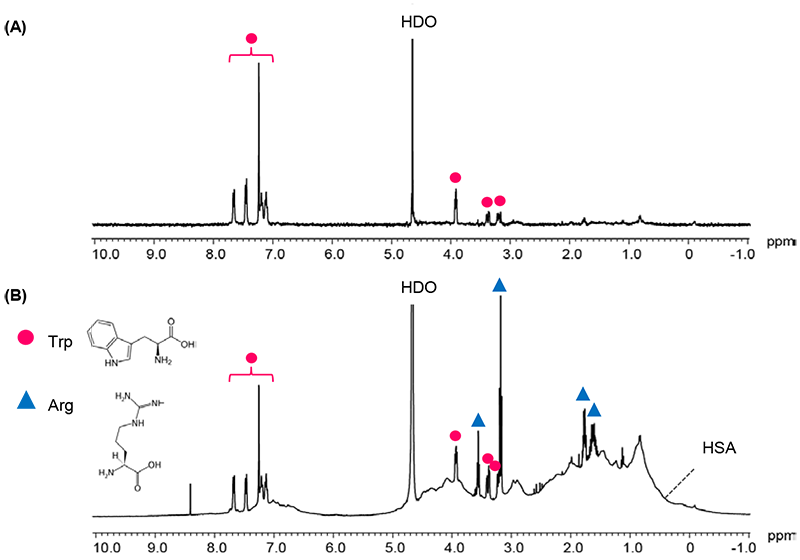
Fig 4: (A) STD spectrum, and (B) 1H spectrum mixture solution of Albumin 0.1mM,Trp 2mM,Arg 2mM /D2O
- (A) STD spectrum: 64 scans, selective excitation position 0.6ppm, non excitation position -10ppm, saturation time 8s, T1ρ filter 50ms
- (B) 1H spectrum: 64 scans
- console: JNM-ECZ400S+ROYALPROBE
DIRECTION (Difference of Inversion RECovery rates with and without Target IrradiatiON)
DIRECTION※1 is a NMR technique to analyze the protein-ligand interaction by longitudinal relaxation time.
In general, signal strength in the STD spectrum increases proportionately to the strength of interaction with protein. Thus, it’s possible to obtain hints about the part of ligand involved in binding.
However, when ligand’s T1 is short, efficiency of saturation transfer decreases. Therefore, STD spectrum analysis needs to take into consideration the T1 of each ligand signal.
DIRECTION is the experiment that estimates the efficiency of saturation transfer by probing not the signal intensity but directly the T1.
DIRECTION is essentially an inversion recovery experiment where T1 is measured twice with saturation transfer and no saturation transfer.
1H signals from ligands that strongly bind to protein show decreased T1.
DIRECTION experiment
In DIRECTION experiment, T1 is measured twice with and without presaturation (Fig.5). Analysis of the changes in 1H’s T1 can identify binding compounds. Protein signals are decreased by T2 filter.

Fig 5: DIRECTION experiment
Reference: Y. Mizukoshi, A.Abe, T.Takizawa, H.Hanzawa, Y.Fukunishi, I.Shimada and H.Takahashi, Angew. Chem. Int. Ed. 2012, 51, 1362-1365.
Results of DIRECTION
Table 1 shows the results of DIRECTION for a mixture solution of 0.1mM HSA, 2mM L-(+)-Arg, and 2mM L-Trp / D2O. T1 of Arginine which has no binding activity shows no significant change when it is measured with and without saturation. On the other hand, Tryptophan's T1 is significantly decreased. Especially 3.22ppm and 3.24ppm's signals are drastically decreased.
Table 1: Results of DIRECTION
| assign | CS/ppm | no presaturation T1/s |
with presaturation T1/s |
Change % | |
|---|---|---|---|---|---|
| 1 | arg | 1.62 | 0.94 | 0.96 | 102.13 |
| 2 | arg | 1.77 | 0.96 | 0.94 | 97.92 |
| 3 | arg | 3.18 | 1.04 | 0.99 | 95.19 |
| 4 | trp | 3.22 | 1.11 | 0.62 | 55.86 |
| 5 | trp | 3.24 | 1.02 | 0.60 | 58.82 |
| 6 | trp | 3.38 | 1.06 | 0.70 | 66.04 |
| 7 | arg | 3.57 | 3.18 | 3.24 | 101.89 |
| 8 | trp | 3.93 | 1.83 | 1.28 | 69.95 |
| 9 | trp | 7.13 | 1.90 | 1.41 | 74.21 |
| 10 | trp | 7.21 | 1.92 | 1.41 | 73.44 |
| 11 | trp | 7.25 | 2.18 | 1.49 | 68.35 |
| 12 | trp | 7.48 | 1.92 | 1.22 | 63.54 |
| 13 | trp | 7.69 | 1.80 | 1.27 | 70.56 |
DIRECTION: 32 scans, loop number 80, relaxation delay 15s, T2filter 80ms, tau interval 0.1~16s 8 points
console: JNM-ECZ400S+ROYALPROBE
- Please see the PDF file for the additional information.
Another window opens when you click. 
PDF 667KB
SEARCH APPLICATIONS
Related Products
Are you a medical professional or personnel engaged in medical care?
No
Please be reminded that these pages are not intended to provide the general public with information about the products.