Separation of Crystalline and Amorphous Signals in Polymers:T1-filter Method
NM130009E
Summary
T1-filter method separates crystalline- and amorphous-phase signals for such mixed-phase samples as solid polymers, by utilizing the difference of their T1 values.
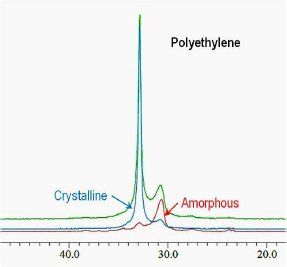
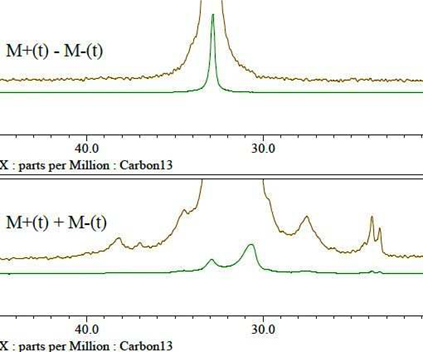
In a polyethylene sample, where the 13C T1 values are longer than 100 s for crystalline-phase and about 1 s for amorphous-phase, the method yields the individual 13C signals separately, as shown in the right figure.
Principles of T1-filter method
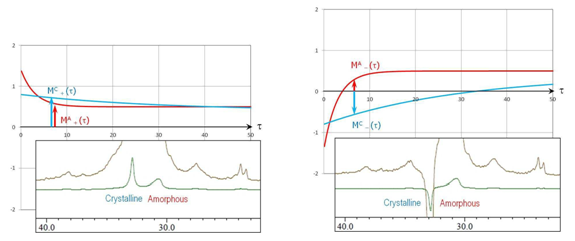
The longitudinal magnetizations are prepared in the +z direction parallel to the external static magnetic field, MA,C+(τ), or those in the -z direction antiparallel to the field, MA,C–(τ), by applying a 90°pulse to CP-enhanced transverse magnetizations. The initial magnetizations approach to the equillibrium ones exponentially with the time constants, TA1 and TC1, for the amorphous- and crystalline-phases, as demonstrated in the lower figure.
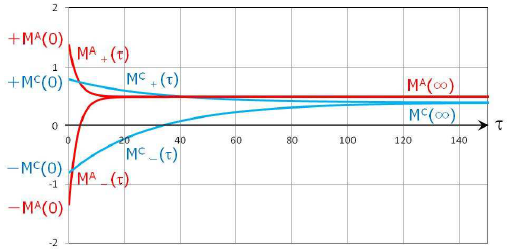
The sum and the difference of the longitudinal magnetizations prepared along the ±z directions behave as depicted in the figures.
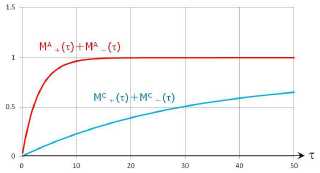
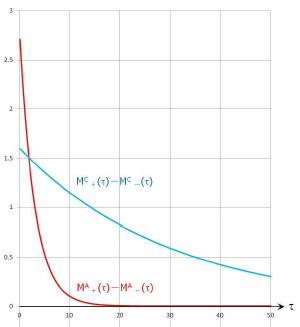
The sum of the magnetizations (left) yields almost only the amorphous-phase signals after short-time longitudinal relaxation (τ ≪ TC1), whereas the difference (right) gives only the crystalline-phase signals after long-time relaxation (τ ≫ TA1). Thus, the T1-filter method separates the signals originating from the crystalline and amorphous phases.
Procedure 1
The pulse sequences,
- cpmas_t1-filter_add.jxp
- cpmas_t1-filter_sub.jxp
respectively add and subtract the magnetizations experimentally.
(1)Determine the experimental conditions which yield CPMAS spectra for the sample of interest.
(2)Set the parameter interval as τ, during which the longitudinal magnetizations relax, to be 1-3 s for most polymer samples.
(If the T1 values for the crystalline and amorphous phases of the samples are determined before the T1-filter measurements, set interval satisfying the conditions, t ≪ TC1 and τ ≫ TA1.)
(3)Accumulated signals (multiples of 16) immediately give the spectra exhibiting the crystalline- and amorphous-phase signals.
Procedure 2
If the +z- and –z-prepared signals are acquired and saved, the addition and subtraction data processing yields the target spectra more efficiently than the procedure 1 does: Both the two data contribute to the signal intensities, improving the S/N ratio by a factor √2. The pulse sequences,
- cpmas_t1-filter_plus.jxp
- cpmas_t1-filter_minus.jxp
respectively accumulate the +z- and –z-prepared signals.
(1)-(3) Conduct the measurements similar to Procedure1; accumulation numbers should be multiples of 8. The results may be as shown below.
(4)Open the “Operate on Files” window in the NMR software Delta console window.
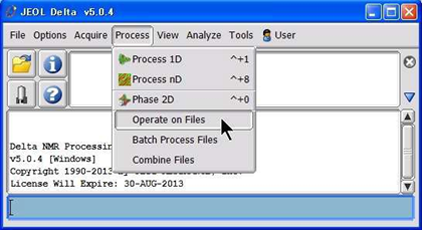
(5)Load FID data and input addition or subtraction expression in the “Operate on Files” window, and process and save the files.
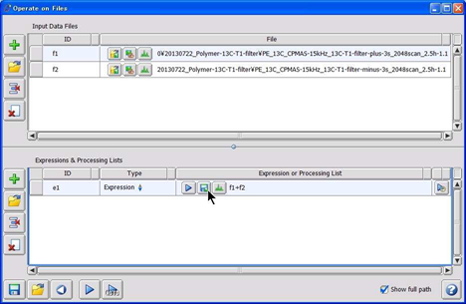
(6)Process the saved data, and then obtain the target spectra.
SEARCH APPLICATIONS
Related Products
Are you a medical professional or personnel engaged in medical care?
No
Please be reminded that these pages are not intended to provide the general public with information about the products.