Material Evaluation using msFineAnalysis Ver. 3 −Fast search and analysis of substance in material by two-sample comparison−
MSTips No.330
Introduction
As polymer materials have become more complex and diverse, the details of their chemical composition have become more critical for the end users. This knowledge allows manufacturers and users to understand the effects of incorporating these polymer materials into their products.
Additionally, it is critical to also have tools that can quickly compare two-samples to each other like conventional materials versus alternative materials, new products versus old products, and good products versus defective products.
Gas chromatography-mass spectrometry (GC-MS) is an analytical technique that is widely used for both qualitative and quantitative analysis of volatile compounds in materials. For these types of measurements, GC-MS analyses typically only involve library database searches to identify each analyte. However, it is not so uncommon to measure unknown analytes that are not registered in the database. So for these compounds, it is not possible to identify with the database search method. To address this problem, we developed the msFineAnalysis software in 2018 that uses an "integrated analysis" approach in which the EI fragmentation information is combined with the soft ionization (SI) accurate mass information for the molecular ion to automatically determine the most logical chemical formula for each analyte.
More recently, msFineAnalysis Ver. 3 was introduced in which a differential analysis function was added to the software that uses t-tests to compare two samples to each other, and Retenion Index search functionality. In this work, we compared two polypropylene/polyethylene (PP/PE) copolymerized polymers to show the differential analysis capabilities of msFineAnalysis Ver. 3.
Analysis Flow
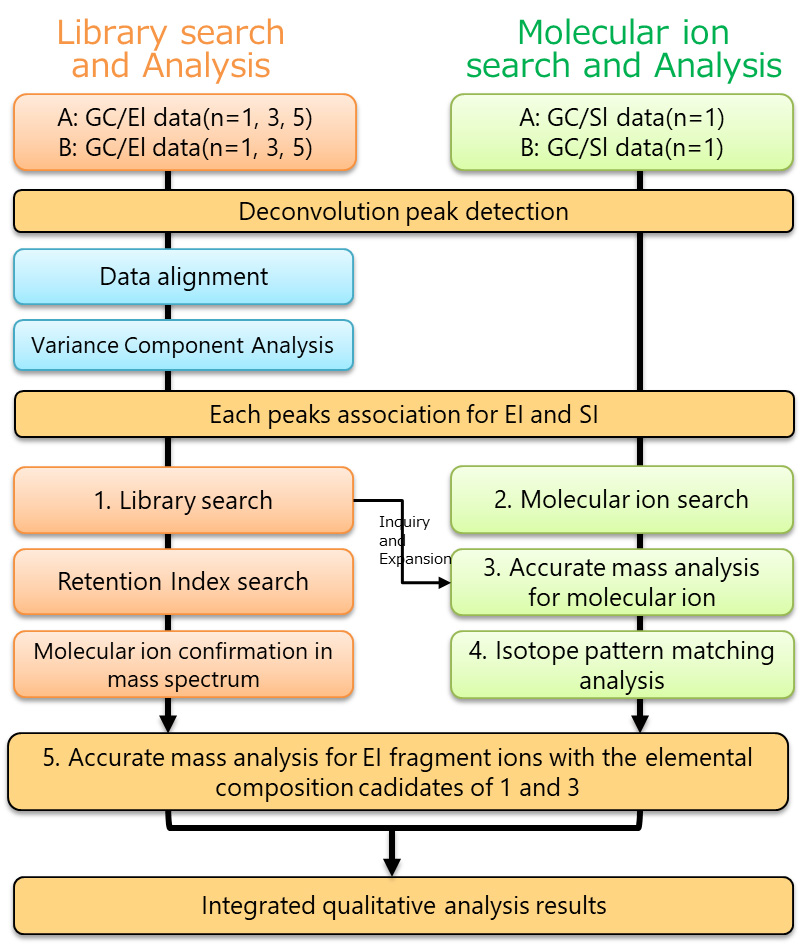
Fig.1 shows the msFineAnalysis workflow in which the new differential analysis feature is combined with the automatic integrated analysis workflow that was previously discussed in our MS Tips application notes (#275, 280, etc.). The workflow first deconvolves the chromatographic peaks and then performs differential analysis using the EI data for the two samples that are being compared to each other. Data alignment (identity determination) is performed based on the similarity between RT value of chromatographic peaks detected in the EI data and the EI mass spectral pattern. For the compounds obtained through the alignment process, the detected compounds are classified based on the number of occurrences, intensity ratio of the mean area value between the two sample data, and the p-value calculated by t-test.
After classifying the compounds, each chromatographic peak observed in the EI data and SI data are linked to each other based on their retention times and recorded as a single component. Afterwards, the msFineAnalysis is used not only to automatically perform quantitative identification of components registered in the library database but also to determine the most likely elemental composition for unregistered components.

Fig.1 msFineAnalysis Ver.3 workflow for the variance component analysis
Experimental
Two PP/PE copolymers (one “good” sample, one “bad” sample) were used as the samples. Table 1 shows the measurement conditions for the pyrolysis GC-MS measurements. A JMS-T200GC equipped with a Frontier Lab pyrolyzer and the JEOL EI/FI combination ion source was used for the measurements. The sample amounts used for each measurement were 0.2mg for the EI method and 1.0mg for the FI method, respectively. The resulting data was then analyzed by using the msFineAnalysis Ver. 3 integrated workflow (Fig. 1) to compare the two PP/PE copolymers as well as to identify the unique components in each sample.
Table 1. Measurement and analysis conditions
| Pyrolysis conditions | |
|---|---|
| Pyrolyzer | EGA/PY-3030D(Frontier Lab) |
| Pyrolysis Temperature | 600°C |
| GC conditions | |
| Gas Chromatograph | 7890A GC (Agilent Technologies) |
| Column | ZB-5MSi (Phenomenex) 30m x 0.25mm, 0.25μm |
| Oven Temperature | 40°C(2min)-10°C/min -340°C(28min) |
| Injection Mode | Split mode (100:1) |
| Carrier flow | He:1.0mL/min |
| MS conditions | |
| Spectrometer | JMS-T200GC (JEOL Ltd.) |
| Ion Source | EI/FI combination ion source |
| Ionization | EI+:70eV, 300μA FI+:-10kV, 40mA/30msec |
| Mass Range | m/z 29-800 |
| Data processing condition | |
| Software | msFineAnalysis (JEOL Ltd.) |
| Library database | NIST17 |
| Tolerance | ±5mDa |
Result
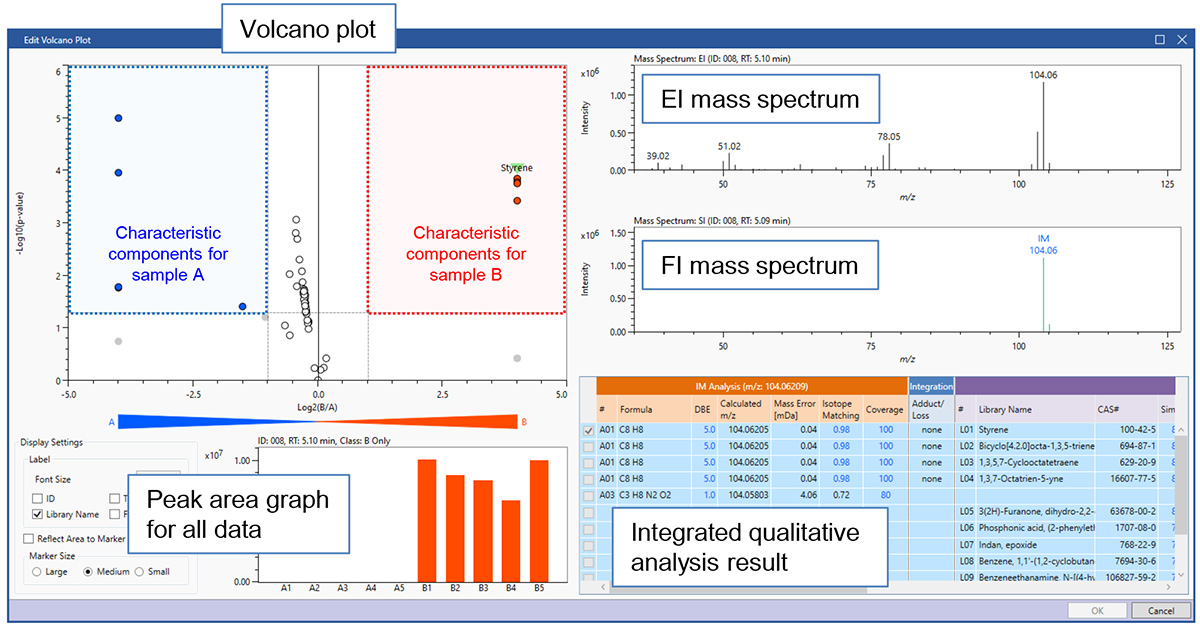
We performed a differential analysis for n=5 sample measurements for Sample A and B that resulted in five characteristic components being uniquely identified in the defective sample (Sample B). The msFineAnalysis Ver. 3 software provides a Volcano Plot where the X axis represents the intensity ratio (Log2(B/A) between the 2 samples and the Y axis represents the statistical reproducibility (-Log10(p-value)) to quickly determine the distinguishing components for each sample. Fig. 2 shows the detailed analysis screen for the Volcano Plot in which the area boxed with blue dots shows the characteristic components for Sample A with high reproducibility, while the area boxed with red dots shows the characteristic components for Sample B with high reproducibility. By selecting each dot on the Volcano Plot, a summary for each component is shown that includes the EI and FI mass spectra, results of the integrated analysis, and chromatographic peak area values obtained for Sample A and Sample B.

Fig.2 Volcano plot of variance component analysis result
Table 2 shows the integrated analysis results for the five unique components in Sample B. Acrylic nitrile (ID003) and styrene (ID008) were detected with a strong intensity, thus indicating the possibility that the substance in the defective sample (Sample B) is an acrylic nitrile/styrene(AS) copolymerized polymer.
Table 2. Integrated qualitative analysis result for the characteristic components of sample B

ID018, 26, 30 are all nitrogen-containing compounds. ID018 is a dimer resulting from the thermal decomposition of the AS copolymer. ID026 and ID030 are not registered in the library database, but the elemental compositions from the integrated analysis results correlate to the mixed trimers shown in Fig. 3. These results strongly suggested that the substance in the defective sample (sample B) was AS copolymerized polymer.

Fig.3 Estimated chemical structures: left: ID026 (C14H14N2), right: ID030 (C19H19N)
Conclusions
The msFineAnalysis Ver. 3 software is a powerful tool for determining differences between samples (conventional materials versus alternative materials, new products versus old products, and good products versus defective products) for all component, including those analytes that are not registered in the EI database libraries. More specifically, the latest version of this software statistically extracts analyte differences between samples and performs an integrated analysis for these analytes that is not dependent on the library database search alone. As a result, msFineAnalysis Ver. 3 can quickly distinguish and identify registered and unregistered components that would be difficult, if not impossible to do by traditional GC-MS qualitative analysis involving EI alone.
- Please see the PDF file for the additional information.
Another window opens when you click. 
PDF 523.7KB
Related Products
Are you a medical professional or personnel engaged in medical care?
No
Please be reminded that these pages are not intended to provide the general public with information about the products.


