Comprehensive Analysis + Unknown Component Analysis of Coffee Samples Using Headspace GC-MS
MSTips No.242
General
Advances in mass spectrometry are enabling analysis of micro samples and unknown components that were not observable before. As the volume of information acquired from mass spectrometry increases, researchers are calling for simple techniques to analyze numerous components observed, and as a result, there is a rise in demand for comprehensive analytical techniques including multiple classification analysis.
In this work, we will introduce a new technique of non-targeted analysis, which combines comprehensive analysis using high resolution GC-MS and unknown component analysis using soft ionization and EI.
Method
Table 1 shows the measurement conditions. Four different types of commercial coffee (A: Indonesian; B: Ethiopian; C: Guatemaran; D: Brazilian) were selected as samples. Each sample was measured 5 times (n=5). The samples were prepared as follows:
- One gram of coffee beans was loaded into a 22 mL headspace (HS) vial, 15 mL of 100℃ water was added, and then the vial was sealed.
- After the sample had cooled to room temperature, 10 mL of the supernatant was loaded into another HS vial, and 2 µL of an internal reference (p-Bromofluorobenzene) was added to the sample.
- Finally, 2 mL of the above solution was sealed in a vial and used as a sample.
Table 1. Mesurement Conditions
Headspace Conditions
| System | MS-62070STRAP (JEOL) |
|---|---|
| Mode | Trap mode |
| Extract | 3 times |
| Heating condition | 60°C, 15min |
GC-TOFMS Conditions
| System | JMS-T200GC (JEOL) |
|---|---|
| Ionization mode | EI+: 70eV, 300μA, FI+: -10kV, 8mA (Carbotec 5μm) |
| GC column | ZB-WAX (Phenomenex), 30m × 0.18mm, 0.18μm |
| Oven temp. | 40°C (3min)→ 30°C/min→ 250°C (10min) |
| Inlet temperature | 250°C |
| Inlet mode | Split30:1 |
| He flow | 1.0mL/min (Constant Flow) |
| m/z range | m/z 35-600 |
| Spectrum recording speed | 0.3 sec |
| Software | AnalyzerPro (SpectralWork) |
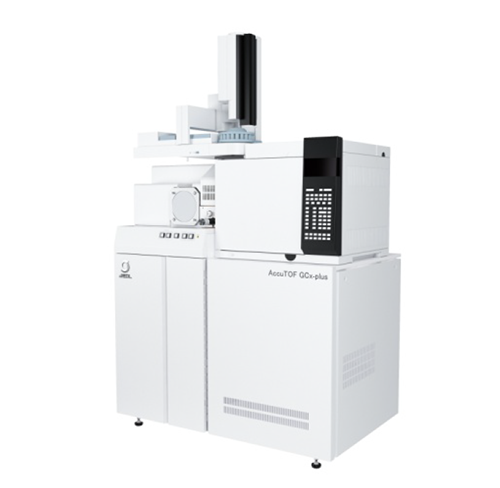
High end GC-MS system (GC-TOFMS):
JMS-T200GC
Results
Figure 1 shows the TIC chromatograms acquired. Among the components observed in each sample, differences between the components detected at high intensity were visible. However, it will be an extremely lengthy process to manually examine all of the detected components. Also, because analysis of micro components hidden under the TIC baseline is likely to produce different results by different operators, auto analysis software capable of peak detection under the same conditions is more effective in comparing the components between samples. For comprehensive analysis of volatile components in coffee, SpectralWorks AnalyzerPro was used. AnalyzePro initially extracts the components in question from the chromatogram through deconvolution. The program automatically searches the NIST libraries for all mass spectra of the components selected by deconvolution. The results are tabulated, and the resulting data is subjected to PCA and diffusion analysis.
Figure 2 shows the results of PCA. The PCA score plot classified the measured data according to where they were grown. Specifically, the 1st principal component axis separated the Indonesian coffee (A) from those produced elsewhere. Next, a PCA loading plot was created to identify the components that contributed to the positive separation of the 1st principal component, that is, characteristic components of the Indonesian coffee (A). Figure 3 shows a magnified view of the 1st principal component axis on the positive side in the PCA loading plot (area within a red circle).
Four components shown in Figure 3 contributed the most to the positive separation of the 1st principal component. Of these, 3 components were identified through NIST library search. For example, pyridine is known as an aromatic component of coffee. The content of pyridine in the Indonesian coffee (A) is twice or more higher than those from elsewhere, indicating that it is a characteristic component in Indonesian coffee.
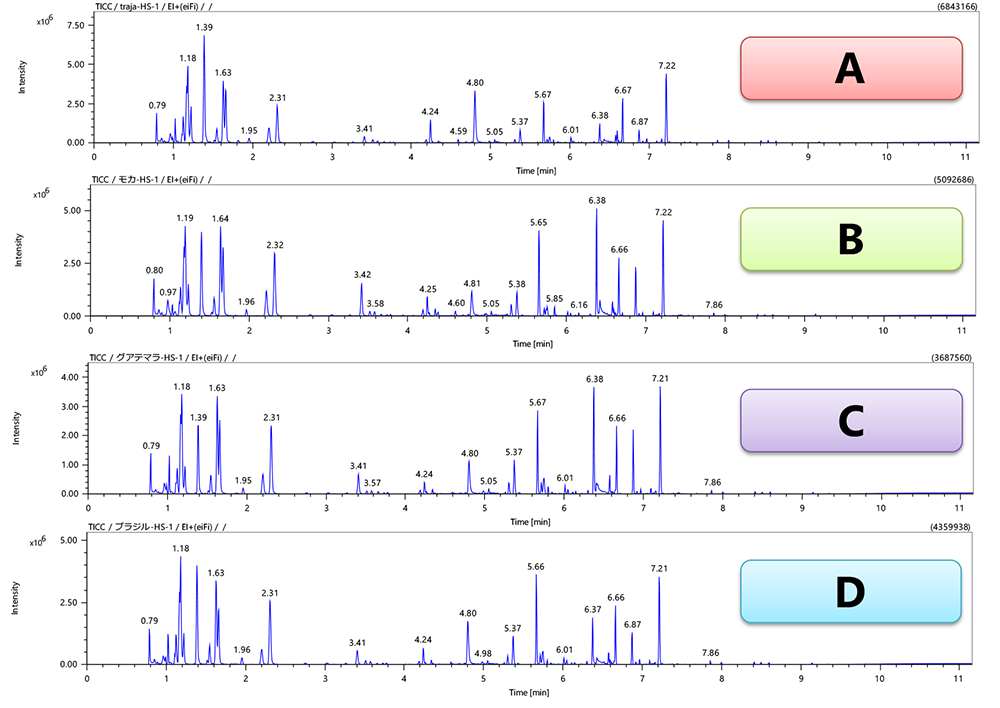
Figure 1. TIC chromatograms.
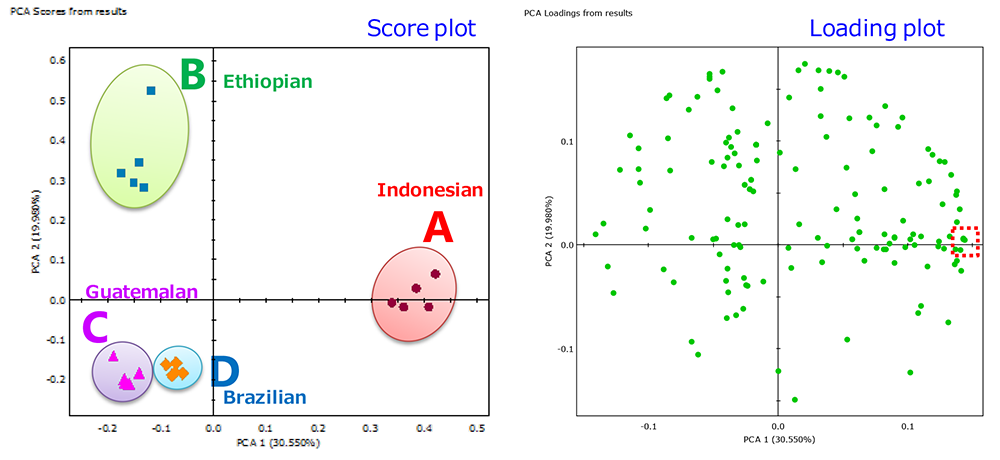
Figure 2. PCA score plot and loading plot.
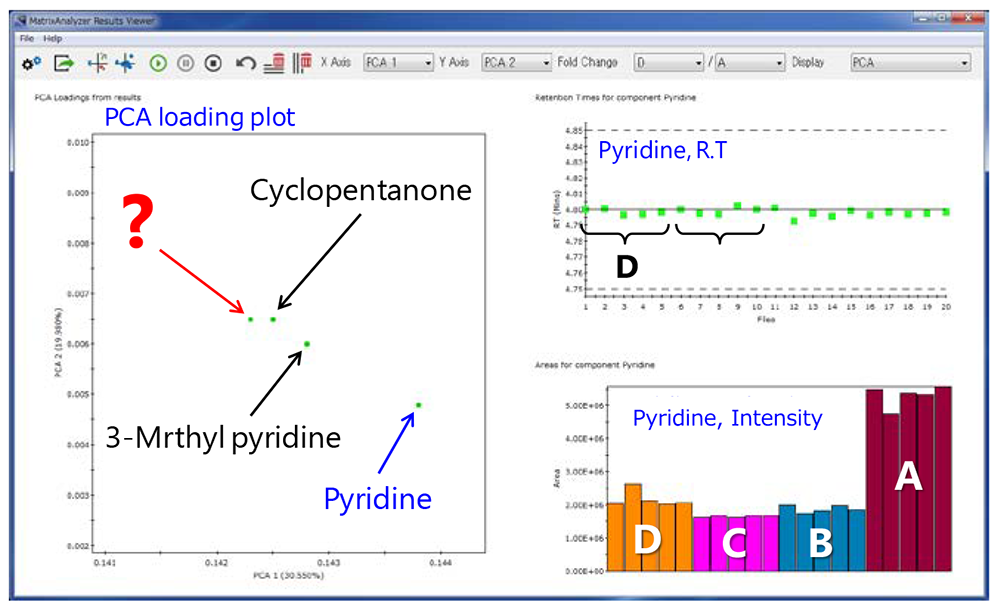
Figure 3. Enlarged view of the PCA loading plot.
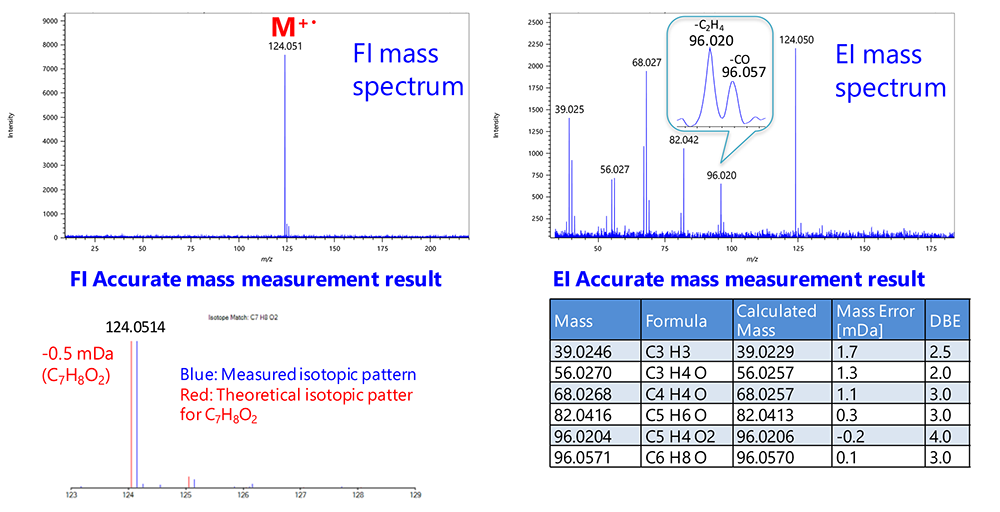
Figure 4. EI and FI mass spectra and exact mass measurement results for the unknown component in the Indonesian coffee.
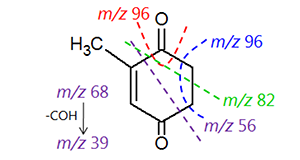
Figure 5. Estimated structural formula for the unknown component in Indonesian coffee.
When a NIST library search was used for one of the 4 components shown in Figure 3 (marked by ? In the figure), the Match Factor was low at 682 for the top candidate, suggesting that this component is not registered in the NIST library database. Thus, the molecular formula of this component was estimated by soft ionization (FI). The structural formula was also estimated by calculating the composition of fragment ions observed by EI.
Figure 4 shows the FI mass spectrum, its isotopic pattern and exact mass analysis results as well as the EI mass spectrum and its exact mass analysis results. The peak at m/z 124 observed in the FI mass spectrum was subjected to exact mass and isotopic pattern analysis and was estimated to have a formula of C7H8O2 and an unsaturation level of 4. Because the level of unsaturation was an integer, it was determined that the peak at m/z 124 was the molecular ion. When the EI fragment ions were subjected to exact mass analysis using each element and its quantity of C7H8O2, the compositions of all fragment ions were determined. This also suggests that the formula for this unknown component is C7H8O2. The structure shown in Figure 5 was estimated from the formulas of the EI fragment ions. The peak at m/z 96 observed as an EI fragment ion was a doublet peak produced by desorption of CO and ethylene from the molecular peak. High resolution MS can identify fragment ions having the same integer value (CO and ethylene are both 28 u) by determining their exact masses. The results demonstrate that accurate composition determination for the EI fragment ions makes it possible to estimate the structure of an unknown component.
Summary
Multiple classification PCA can extract characteristic components that distinguish multiple samples. If any extracted component is not registered in the NIST library database, low resolution GC-MS is unable to identify the component. For these situations, it is effective to use a high resolution GC-MS capable of exact mass analysis combined with soft ionization to estimate the molecular formula and with EI to estimate the structural formula.
- Please see the PDF file for the additional information.
Another window opens when you click. 
PDF 1.27 MB
Solutions by field
Are you a medical professional or personnel engaged in medical care?
No
Please be reminded that these pages are not intended to provide the general public with information about the products.