Analysis of cyanoacrylate adhesive using the JMS-S3000 “SpiralTOF™” — Application of Kendrick Mass Defect plot analysis —
MSTips No.220
SpiralTOF™ has been used previously for the detailed characterization of polymers and lipids. Due to the high mass- resolution of SpiralTOF™, slight mass difference between CH4 and O (Δ 0.036 Da) can be easily discriminated. However, the analysis of complicated compounds by high mass-resolution MS requires an effective data processing method. Recently, Kendrick mass defect (KMD) plot analysis has been proposed as an effective data processing technique for SpiralTOF™ which allows for the structural characterization of complicated compounds1, 2. Here, a commercial acrylic adhesive containing cyanoacrylate was characterized using a SpiralTOF™ combined with KMD plot analysis.
Experiment
A solution of the acrylic adhesive was prepared by dissolving 10 mg of the sample in 1 ml of acetone. The matrix (2,5-dihydroxybenzoic acid, DHB) at concentration of 10 mg/ml in tetrahydrofuran (THF) was used as a matrix solution. Sodium iodide was used as the cationization reagent. MALDI mass spectra were measured by SpiralTOF™ (R=75000). The KMD plots were constructed using the msRepeatFinder software (JEOL).
Results and discussion
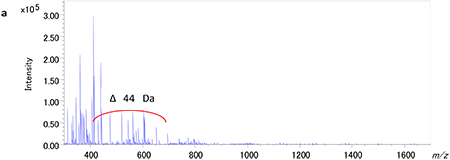
Figure 1a shows the MALDI mass spectrum of the acrylic adhesive in the range of m/z 300-1700. Peak intervals with 44 Da were mainly observed in the range of m/z 400-700. Based on the accurate masses, those peaks are likely from polyethylene oxide (PEO) whose repeating unit is C2H4O (44.026). Figure 1b shows the KMD plot for the acrylic adhesive when the base unit is set for ethylene oxide (EO) repeating unit. The dots lined up in the horizontal axis inside a black circle suggests the existence of PEOs with different end groups. The dots distributing along the right oblique directions marked by red or blue ellipses indicate the presence of two other types of polymers. The four blue groups suggest the presence of multibranched compounds with 4 different reaction starting points. The peak intervals of the components giving the dots in the red ellipse suggest cyano ethyl acrylate acrylate (C6H7NO2:125.047).
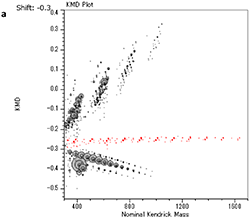
Therefore, the KMD plot was set for the C6H7NO2 repeating unit as shown in Figure 2a, where the dots in the red ellipse in Figure 1b are aligned in the horizontal axis. These results suggest that the acrylic adhesive sample used in this report consists of cyano ethyl acrylate which is widely used for instantaneous adhesives. In addition, the msRepeatFinder has “Grouping Mode” function, which enables us to change the color of the peaks in the mass spectrum corresponding to the selected dots in the KMD plot (Figure 2b). This function is useful for the comparison of KMD plots and the peaks of interest in the mass spectrum.
 |
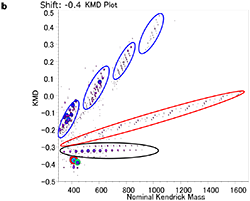 |
【Fig.1 MALDI mass spectrum of an acrylate adhesive(a) and KMD plot of the adhesive using a mass scale based on EO unit(b). 】
 |
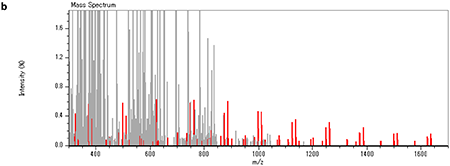 |
【Fig.2 KMD plot of the adhesive using a mass scale based on C6H7NO2 unit (a) and MALDI mass spectrum of an acrylate adhesive (b). Peaks and dots corresponding to cyanoacrylic acid ethyl ester were indicated in the red color.】
Conclusion
Here, acrylic adhesive was characterized using a combination of high-resolution SpiralTOF™ measurements and KMD plot analysis. The KMD plot allows us to visualize the distribution of weak peaks corresponding to polymers which are hidden within a complicated mass spectrum. Since the KMD plot analysis does not require peak assignment and is able to be constructed by selecting a monomer unit or entering the calculated- or observed-mass of the monomer unit, this technique enables the quick and easy visualization of the homologue distribution for different chemical structures. The combination of the SpiralTOF™ instrument and "msRepeatFinder" KMD plot analysis software is an effective tool for the characterization of industrial products containing a variety of materials.
References
1) Sato,H. et al., Structural characterization of polymers by MALDI spiral-TOFMS combined with Kendrick mass defect analysis,
J. Am. Soc. Mass Spectrom., 25, 1346 (2014).
(Open access: http://link.springer.com/article/10.1007%2Fs13361-014-0915-y)
2) Zheng, Q. et al., Molecular composition of extracts obtained by hydrothermal extraction of brown coal, Fuel, 159, 751 (2015).
Acknowledgement
We would like to acknowledge Dr. H. Sato of Environmental Management Research Institute, National Institute of Advanced Industrial Science and Technology (AIST), for his comments and suggestions.
- Please see the PDF file for the additional information.
Another window opens when you click. 
PDF 1.17MB
Solutions by field
Are you a medical professional or personnel engaged in medical care?
No
Please be reminded that these pages are not intended to provide the general public with information about the products.