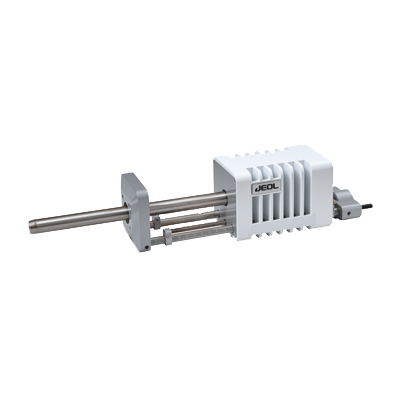
Energy Dispersive X-ray Spectrometer
EDS for JEOL SEM
EDS (Energy Dispersive X-ray Spectrometer) is an attachment for electron microscopes. It detects characteristic X-rays emitted from a specimen by electron beam irradiation, enabling elemental analysis.
JEOL is the only manufacturer that has both in-house EDS and electron microscopes. JEOL offers EDS developed by JEOL exclusively for each SEM model.
Fully integrated with the SEM operation screen, direct analysis is always possible from the observation screen even during SEM operation.
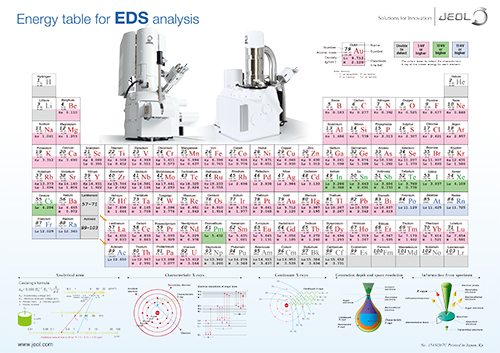
Energy table for EDS analysis for downloading
You can download the PDF data of the characteristic X-ray energy table for EDS analysis here. We hope that you find it useful for your work and research.
Features
The operation icon for simple operation that is integrated with SEM
Display of EDS spectrum (Live Analysis) and elemental map (Live Map) is possible all the time even during an SEM observation.
The image and movie are examples of the JCM-7000 NeoScope™ table-top scanning electron microscope.
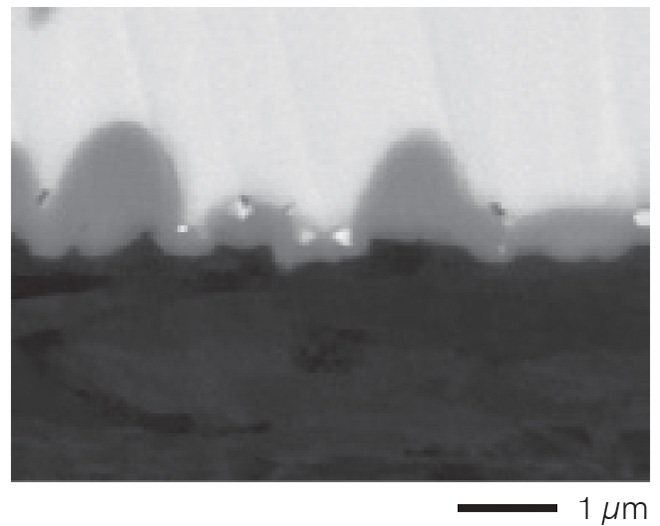
Automatic generation of alloy layer from elemental map!
Simple & useful phase analysis.
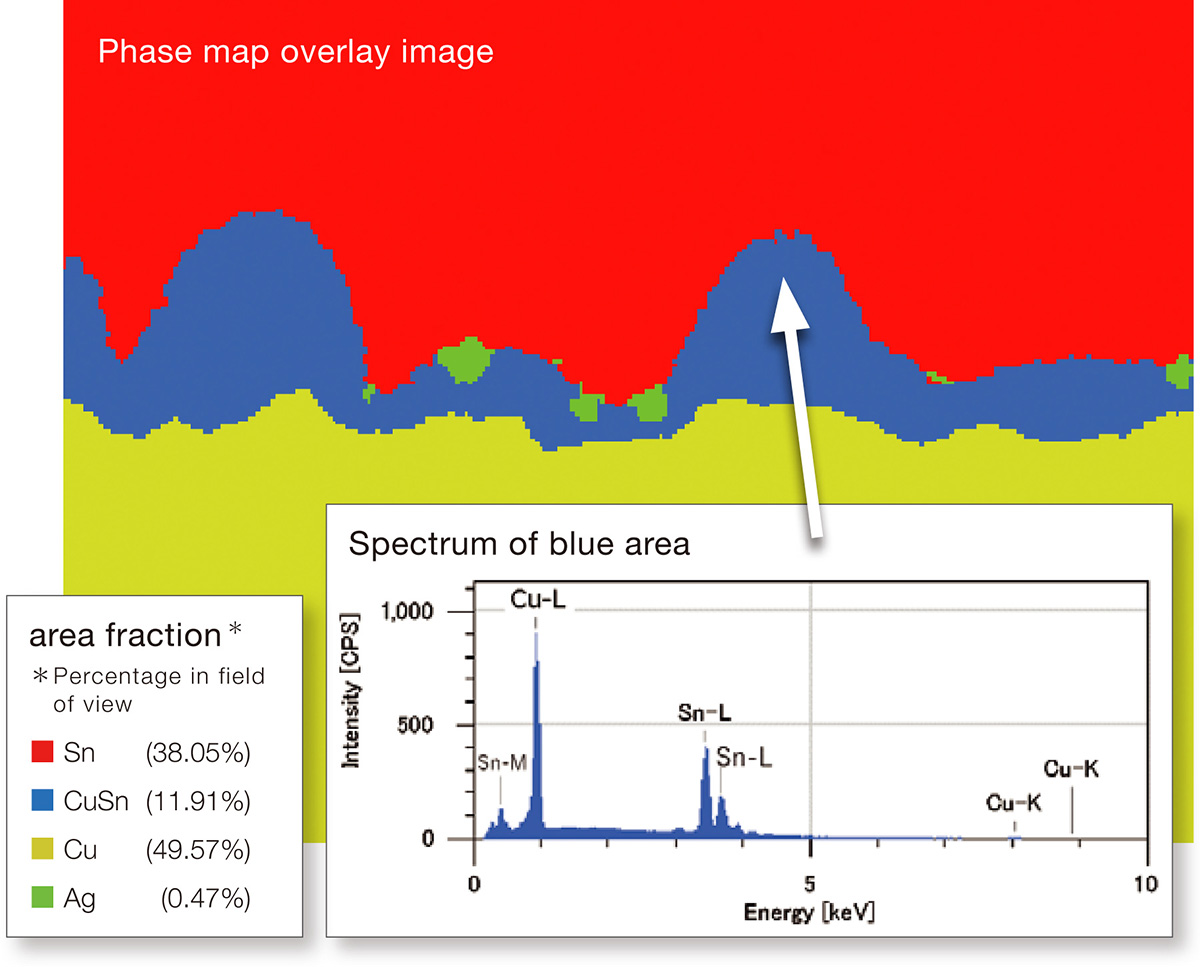
Displaying distribution of elements only to compound!
Visual display is possible with two kinds of phase analysis (Cluster and VCA)!

For phase analysis (in red frame), the single click of a button will perform phase separation from the mapping data.
Cluster phase analysis--- same compound displayed in the same color
VCA phase analysis---compounds with shade contrast (more/less components are shown)
Basically, it is automated. But manual setting of the number of phases is possible.
Backscattered Electron Composition Image
Cluster phase analysis mode
Never miss an element or specimen change!
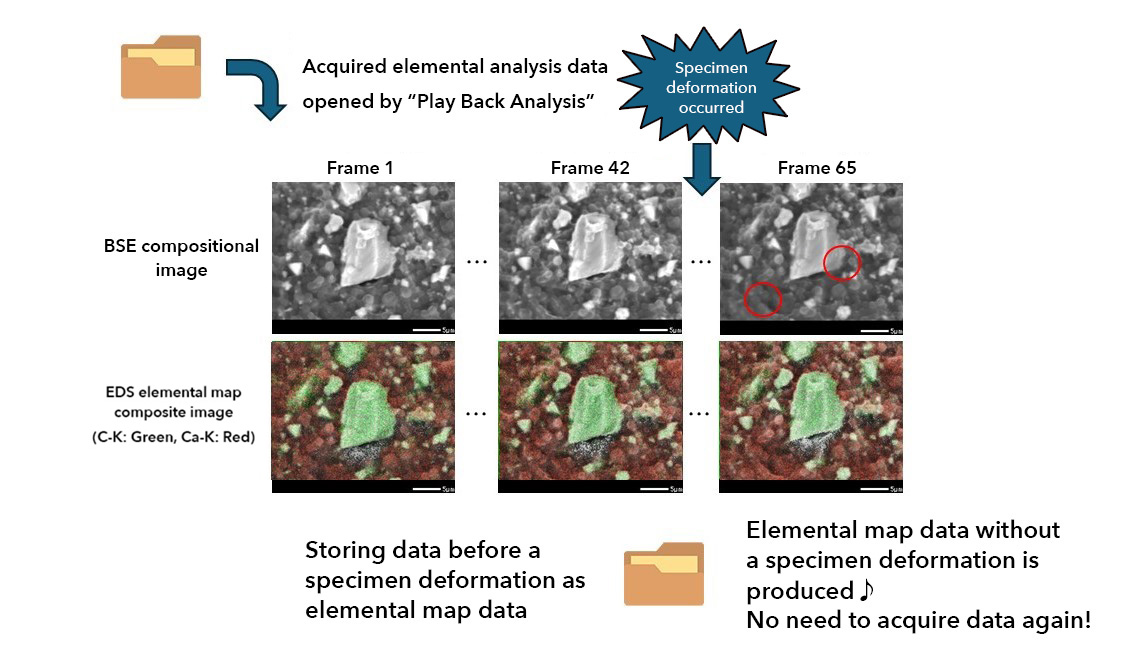
Record changes with time of EDS by play back analysis.
Example of use 1
Useful for shape/elemental distribution change observations (in-situ observation) by heating/cooling within an SEM!
EDS elemental maps of eraser surface were acquired, made into a movie by play back analysis (140 times speed).
The movie has captured how the surface of a sand eraser deformed by an electron beam and how elemental distribution changed accordingly.
Example of use 2
When a specimen deforms during elemental mapping, this function can extract the data before the deformation only and submit it!
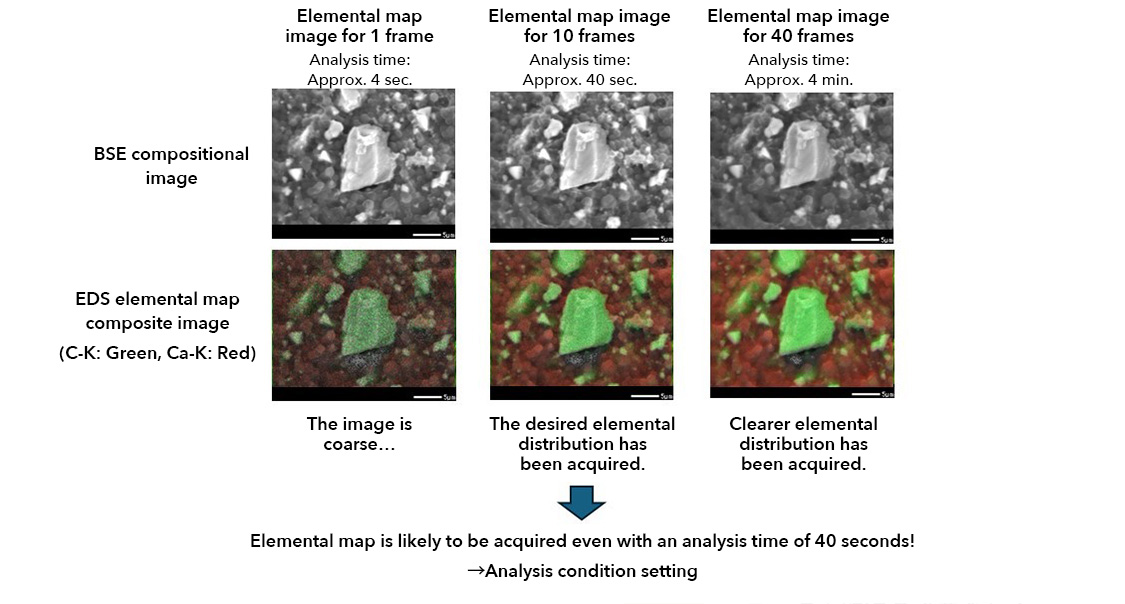
Example of use 3
Useful for adjustment / estimation of number of integrations for elemental mapping!
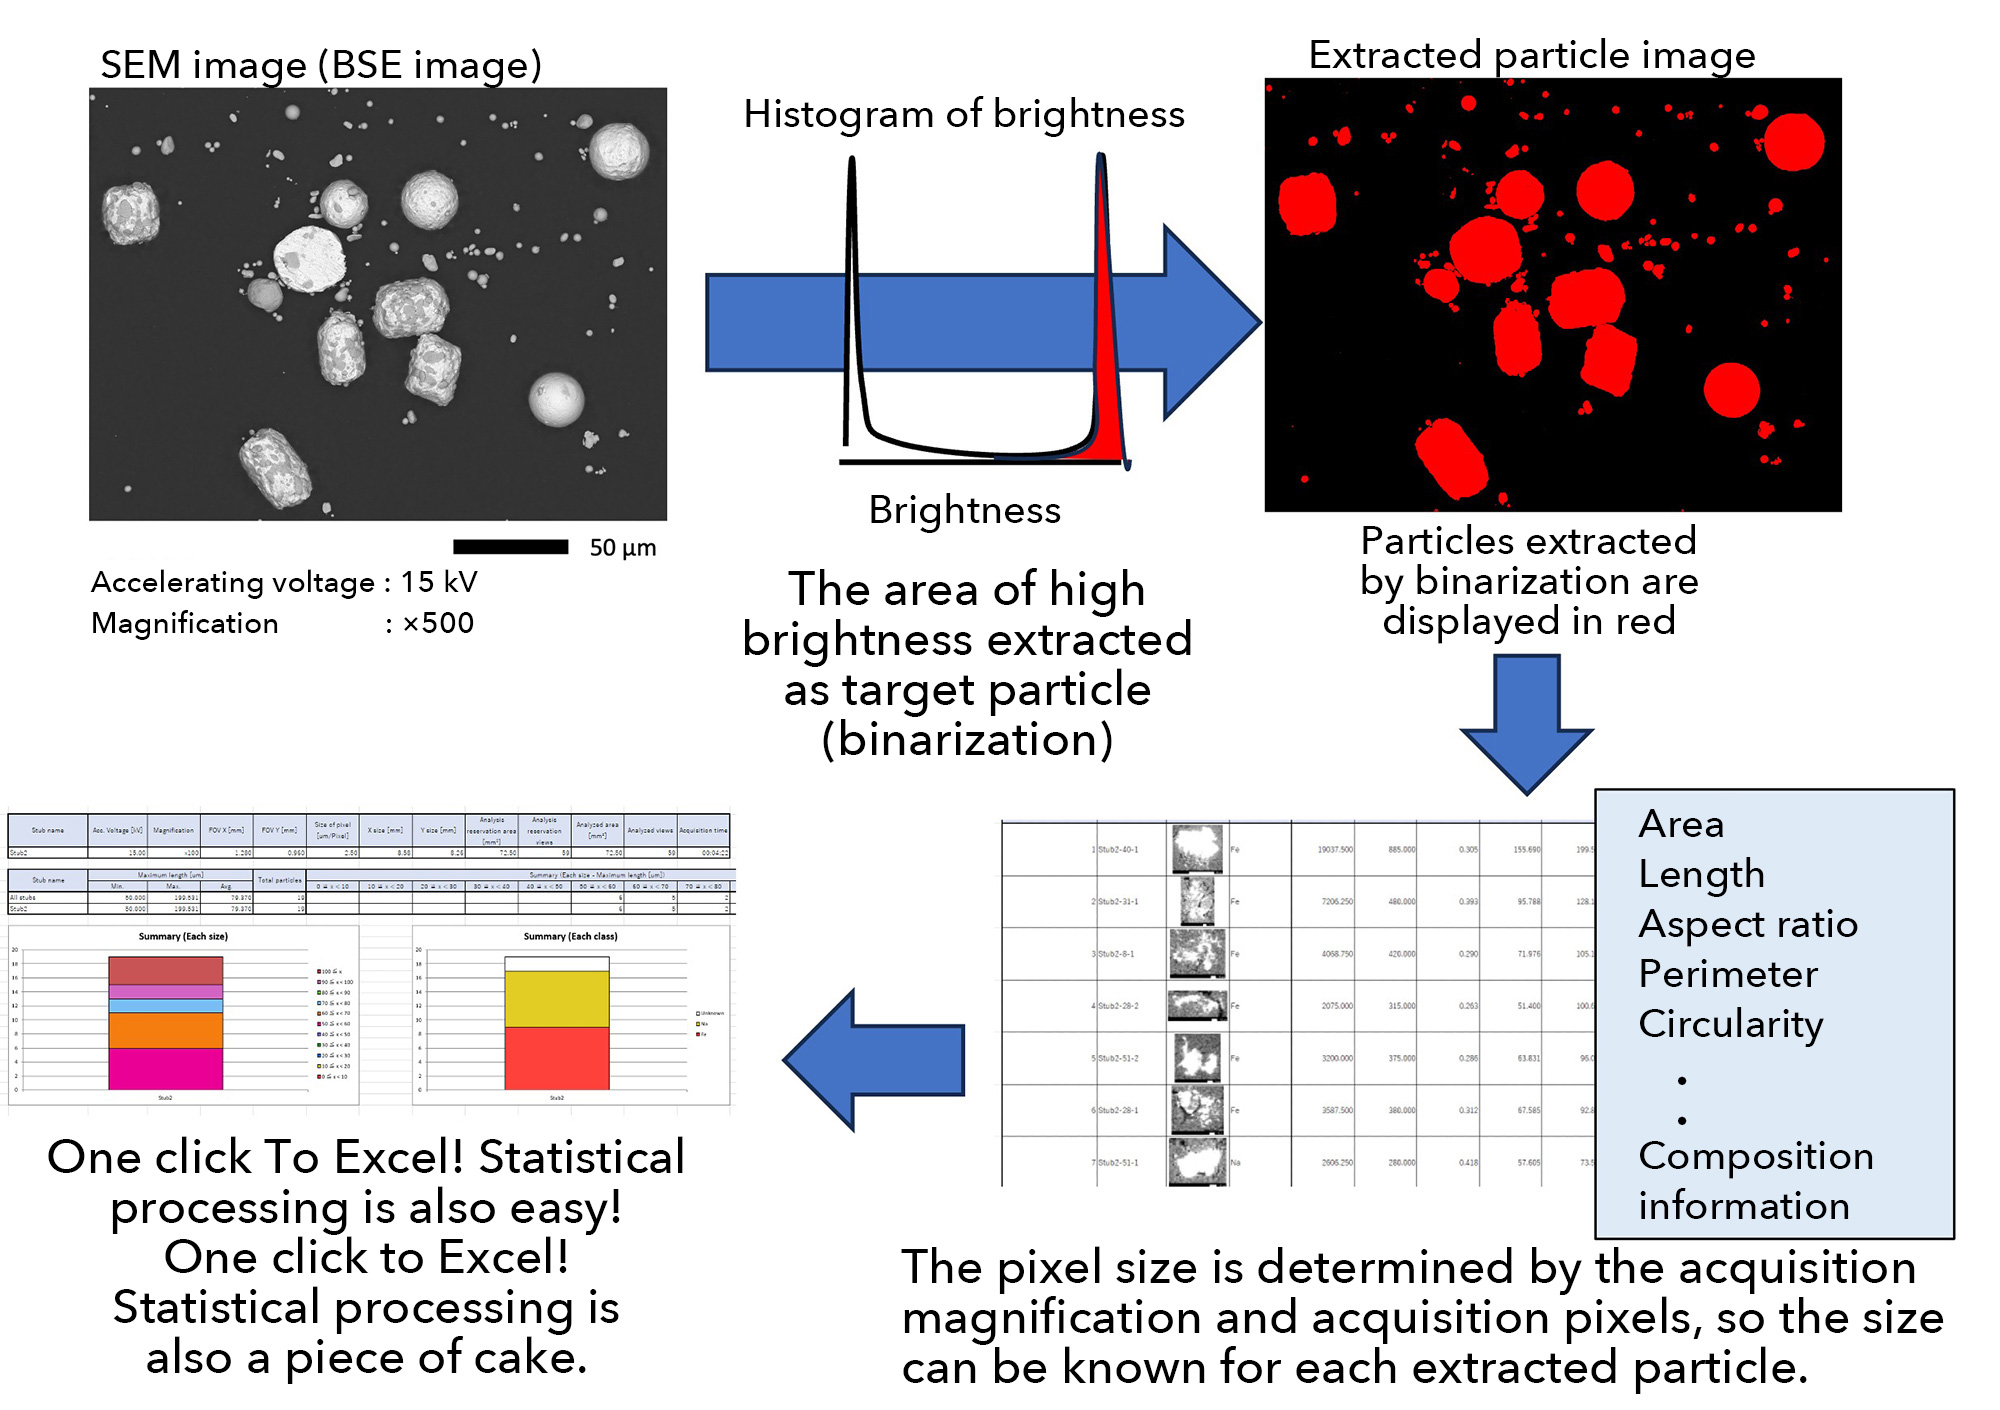
Reliable partner for automatic measurement of number of particles, size, and elemental information! Particle analysis
Specifications
JEOL EDS common specification
Detector type: SDD (liquid nitrogen)
Detectable element: Be to U
Standard function: Qualitative analysis, simplified quantitative analysis, elemental map, map montage
Optional functions: Phase analysis, play back, particle analysis, etc.
| JCM-7000 | JSM-IT210 | JSM-IT510 JSM-IT710HR |
JSM-IT810 | |
|---|---|---|---|---|
| Light-receiving area (mm2) | 30 | 30, 60 | 30, 60, 100 | 30, 60, 100 |
| Multiple EDS | ー | ー | 〇 (Up to 3) | 〇 (Up to 3) |
| Gather-X detector | ー | ー | ー | 〇 (Up to 3) |
* Numbers in bold are standard specifications for each instrument.
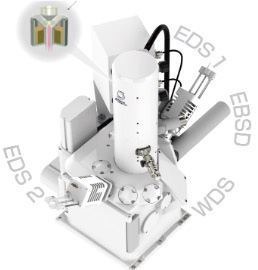
The integration of the SEM and EDS allows for multiple EDS insertions to observe uneven specimens without shadows and to speed up and eliminate damage to specimens that are susceptible to electron beam damages!
Related Products
Scanning Electron Microscope (SEM)
More Info
Are you a medical professional or personnel engaged in medical care?
No
Please be reminded that these pages are not intended to provide the general public with information about the products.