Gas Chromatograph Mass Spectrometer
What is a gas chromatograph-mass spectrometer (GC-MS)?
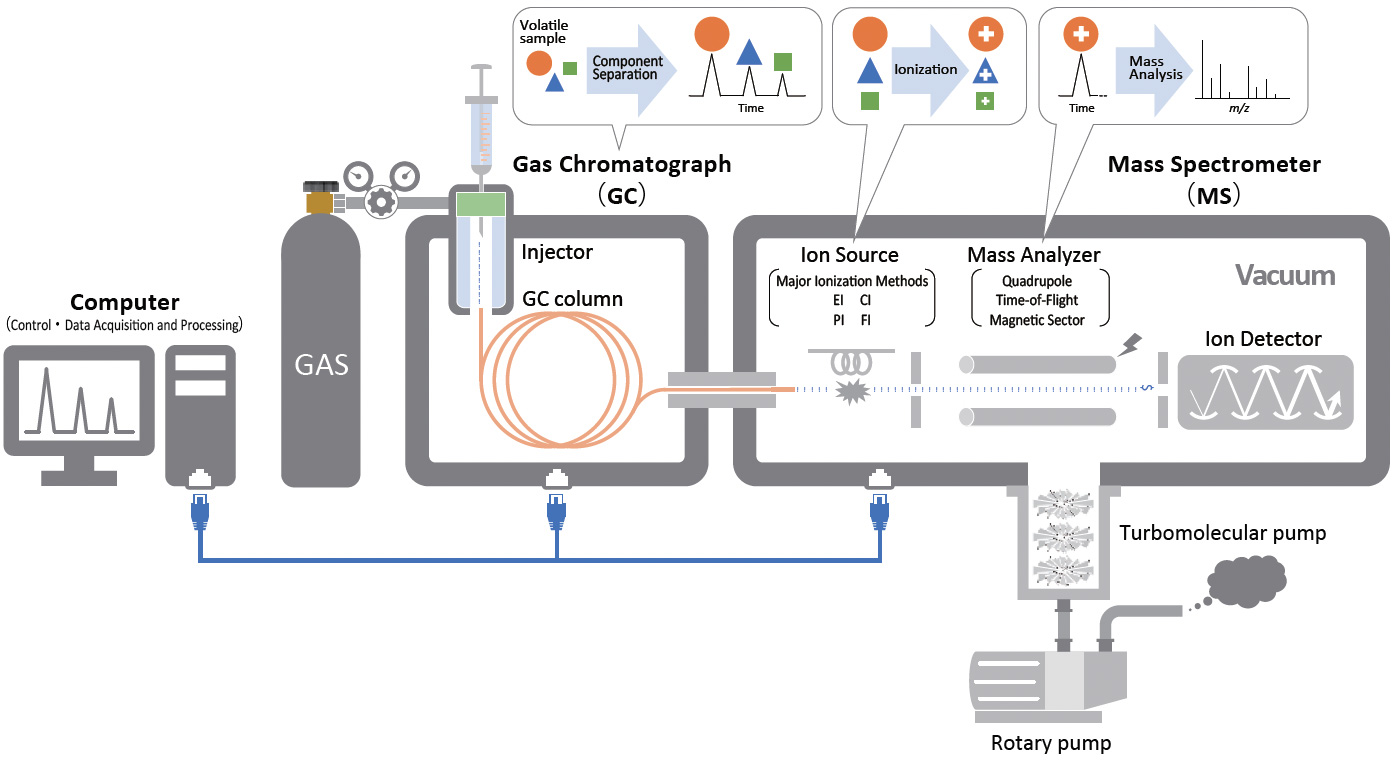
Gas chromatograph-mass spectrometer (GC-MS) is an analytical instrument combining a gas chromatograph (GC) and mass spectrometer (MS). The GC separates vaporized mixed components based on the principle of distribution chromatography, while the MS ionizes organic compounds eluted from the GC and separates and detects them according to the mass of the ions. The target components of GC-MS are volatile compounds, and it is widely used for qualitative analysis of organic compounds and quantitative analysis of hazardous substances in the environment, etc.
Information obtained with GC-MS
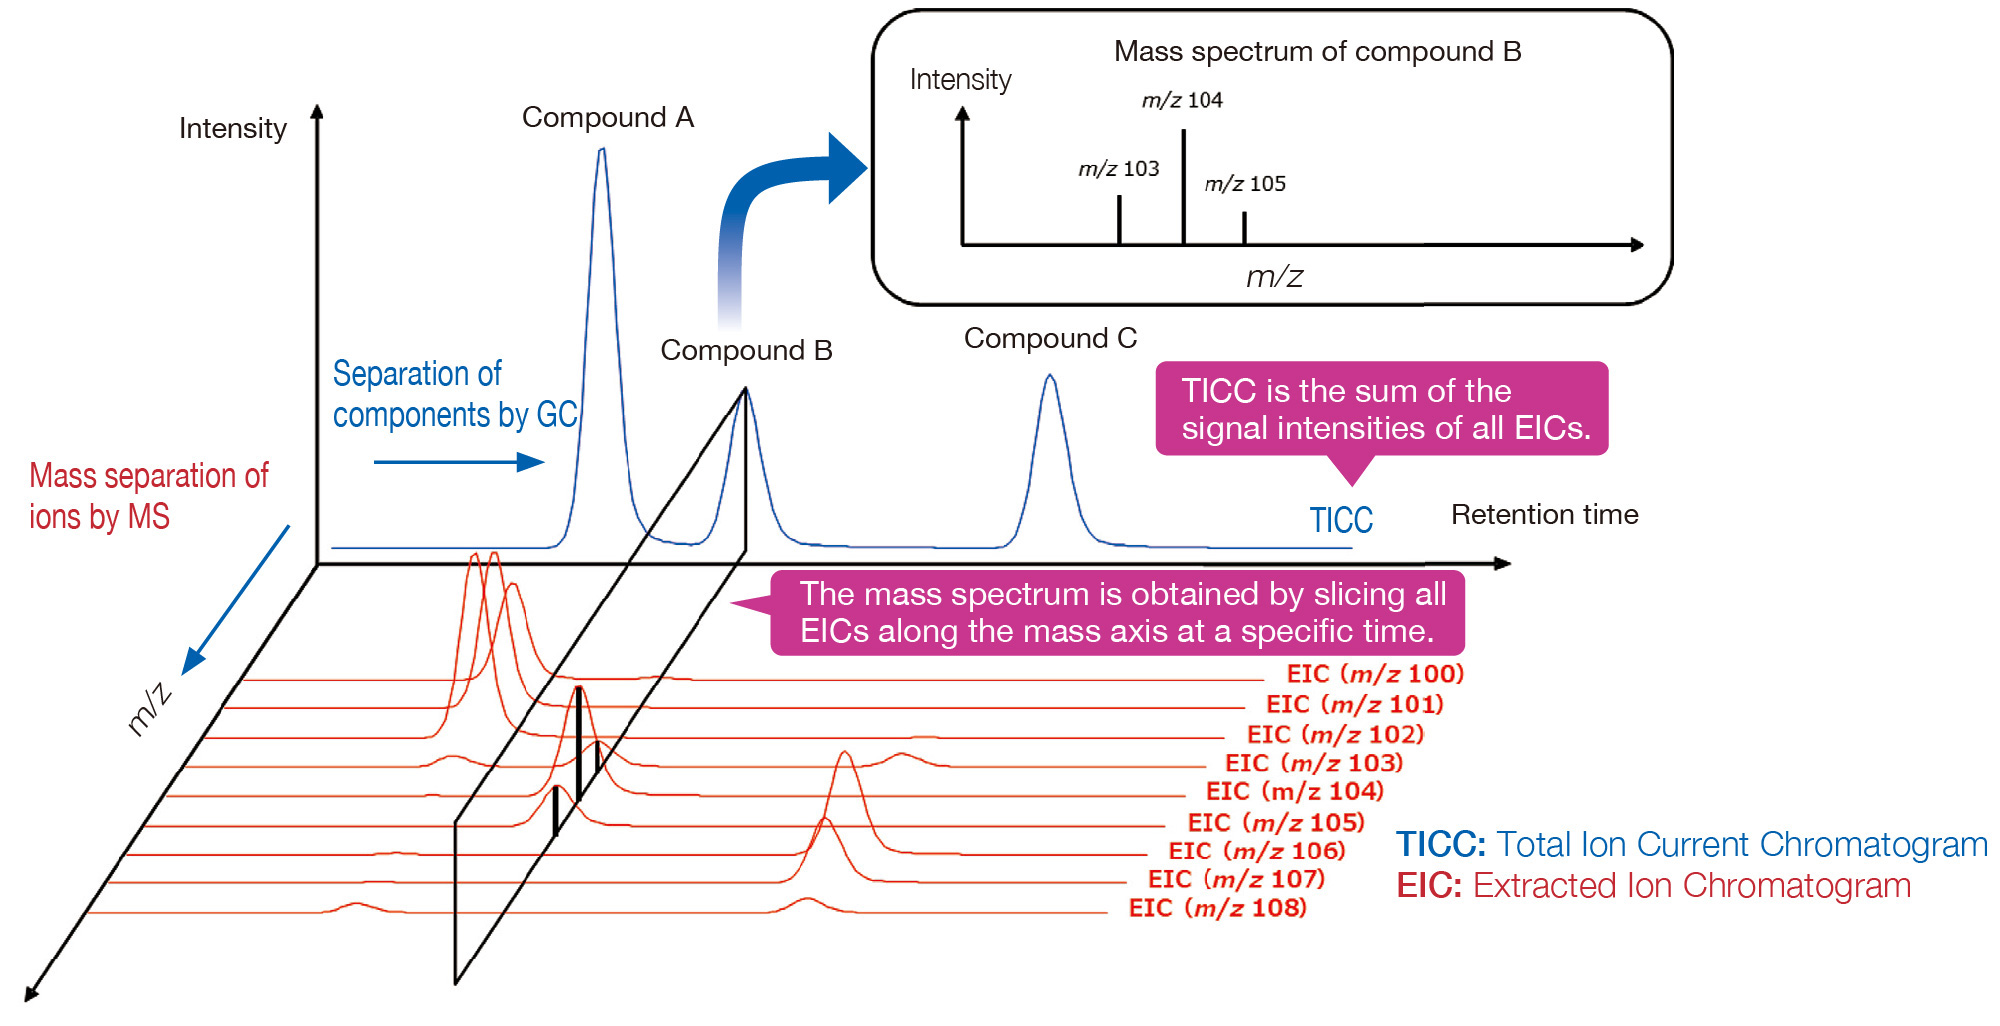
Chromatograms are obtained by separating mixed components using with GC. The chromatogram, which is a plot of total ion currents versus time, is called a total ion current chromatogram (TICC). Separated components are ionized in the MS, and their mass (m/z) is measured to obtain a mass spectrum. The relationship between the TICC and mass spectrum is shown in the figure below.
Information obtained from mass spectra
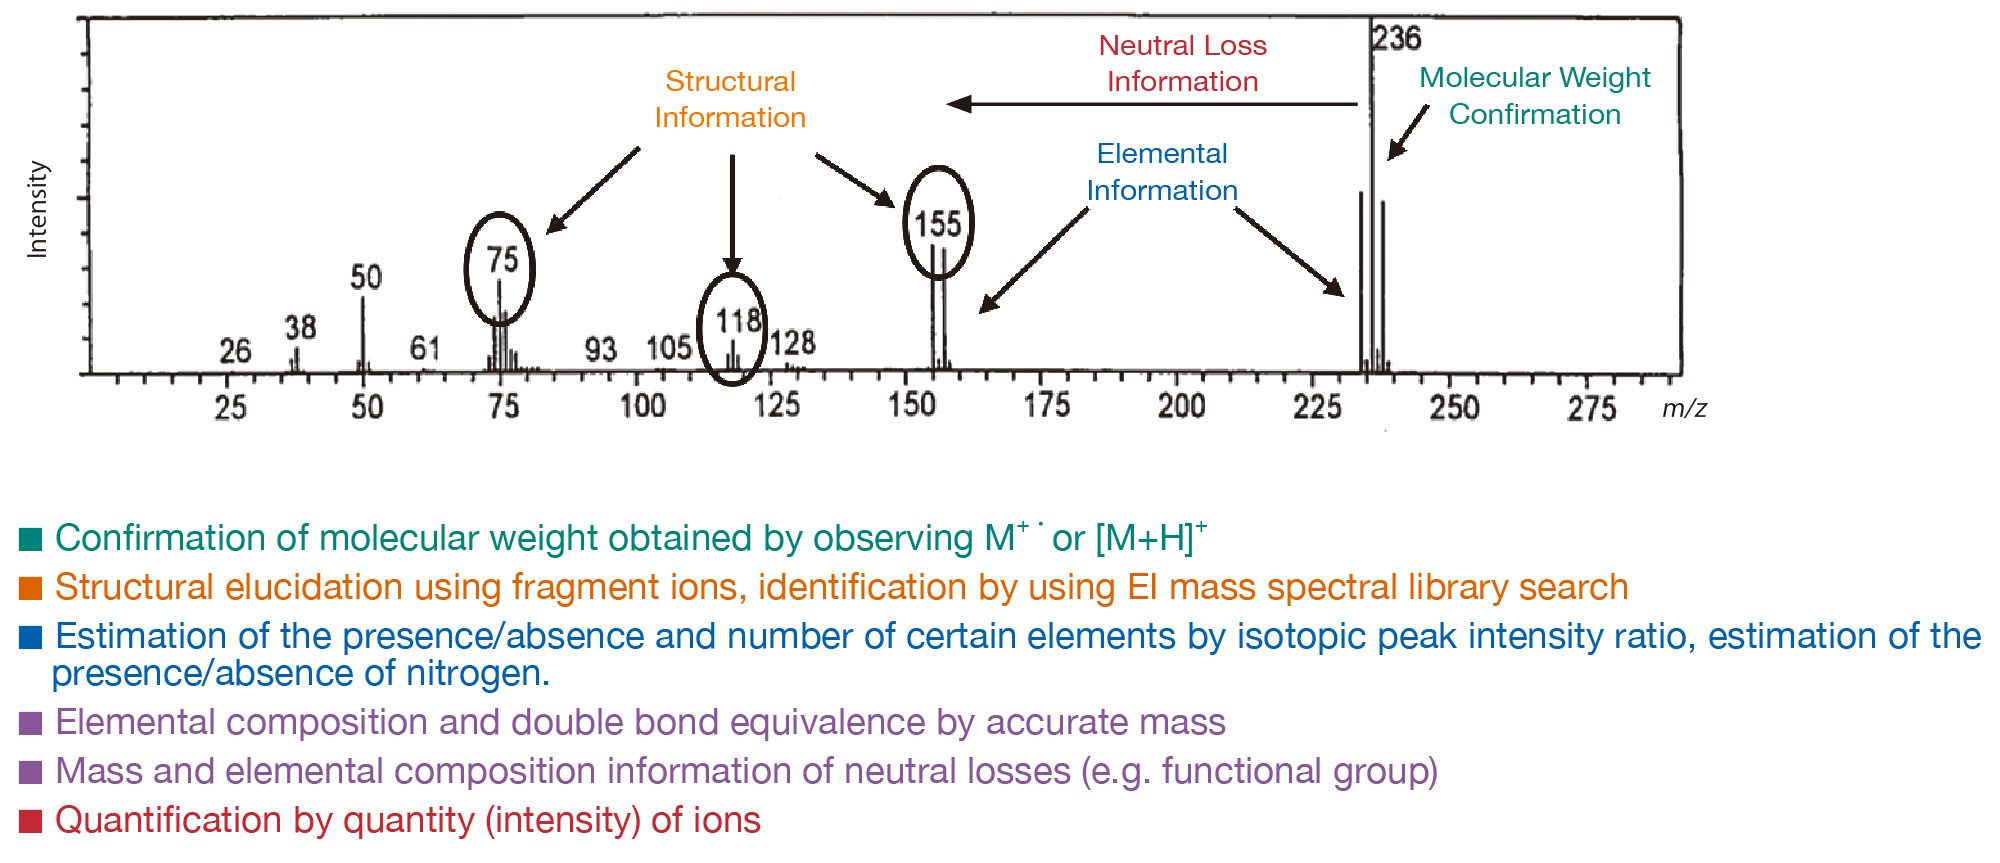
Mass spectra provide the following information.
What can GC-MS do?
Analysis by GC-MS can be broadly classified into qualitative and quantitative analysis.
Qualitative analysis
- To find out what components are in the sample.
- Most of the analysis is done by EI mass spectral library search.
- Unknown substances not yet
registered
in the library may be targeted.
- Analysis in combination with EI and soft
ionization method data.
⇒ GC-QMS, GC-TOFMS - Detailed analysis with measured accurate
mass.
⇒ GC-TOFMS
- Analysis in combination with EI and soft
ionization method data.
- In the analysis of unknown
compounds,
ions that indicate molecular weight are critical.
- In addition to the EI method, soft ionization techniques are also necessary.
Quantitative analysis
- To measure the amount of a component in a sample.
- Analyze by comparison with standard compounds.
- Known substances are
targeted,
and quantitative analysis of unknown substances is rarely performed.
- Clean samples
(volatile organic compounds in water, etc.)
⇒ GC-QMS - Dirty samples
(pesticide residues in food, dioxin analysis, etc.)
⇒ GC-TQMS
- Clean samples
- Absolute intensity (sensitivity)
and
stability of ions are important.
- EI method is mainly used.
Application Range of GC-MS
GC-MS is used in a wide range of applications for both qualitative and quantitative analysis of volatile compounds.
- Natural Products Chemistry / Synthetic Organic
Chemistry
- Molecular weight confirmation, structural analysis
- Chemistry / Materials
- Synthetic polymers
- Materials
- Additives
- Petroleum
- Environmental analysis
- POPs (Persistent Organic Pollutants: dioxins, PCBs, pesticides, etc.)
- Water, atmosphere and indoor air
- Biochemistry / Medicine / Pharmacy / Forensics, etc.
- Metabolomics
- Doping testing
- Narcotics, stimulants, designer drugs
- Explosives and gunpowder
- Others
- Aroma components
- Gas analysis
About GC for GC-MS
About Inlet and Injection Mode for GC
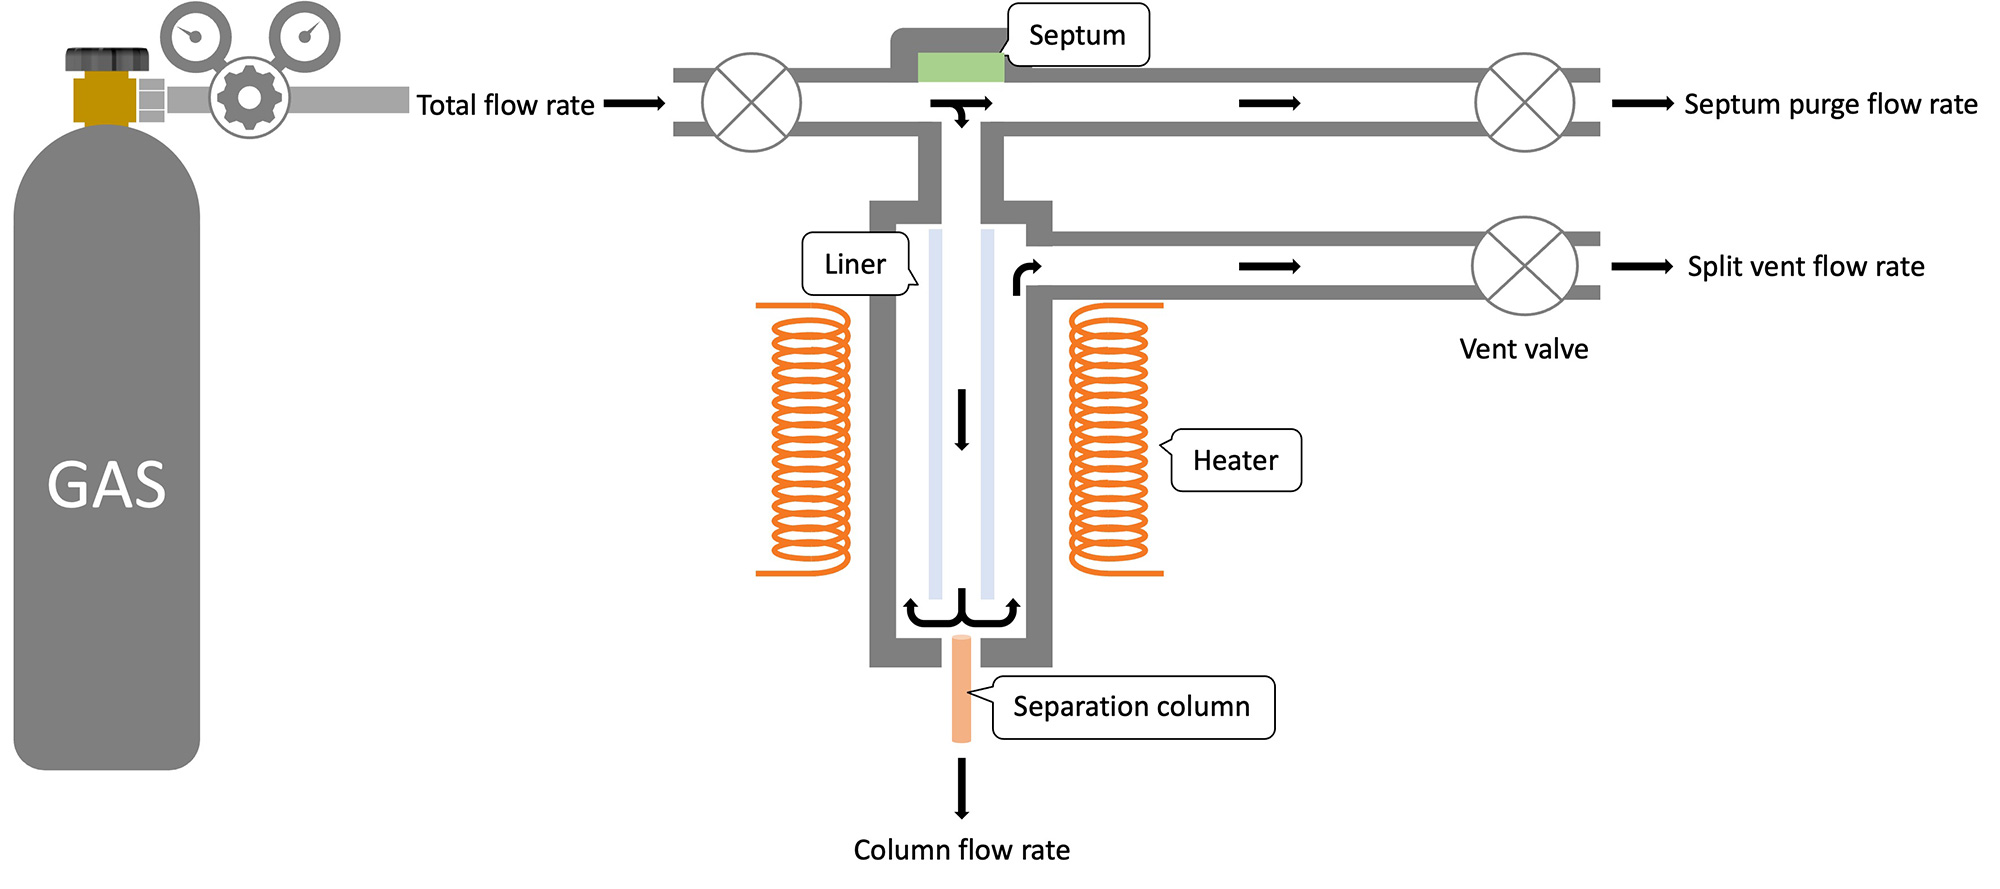
The GC inlet is where the sample is vaporized and introduced into the separation column. Injection modes include split and splitless modes, and the appropriate mode must be selected for analysis.
- Split mode
In this mode, a portion of the vaporized sample is introduced into the separation column at any split ratio. The split ratio (ratio of column flow rate to split vent flow rate) is determined by considering the amount of loading to the column and the sensitivity of the target compound. - Splitless mode
In this mode, the entire injected volume is introduced into the separation column. It is suitable for the analysis of trace components due to the large absolute volume introduced into the column.
Column Types and Selection
A capillary column is a tube made of fused silica whose inner wall is
coated with a polymer known as the stationary phase.
The type of stationary phase, column length, inner diameter, and film thickness affect
separation, so it is important to understand each characteristic and select an appropriate
column.
- The type of stationary phase
Capillary columns have different characteristics (polarity, maximum operating temperature, etc.) depending on the type of stationary phase coated on the inner wall. In general, selecting a stationary phase with polarity close to that of the target components will result in a good peak shape due to its affinity. When components are analyzed on a column with low polarity, they elute in the order of their boiling points.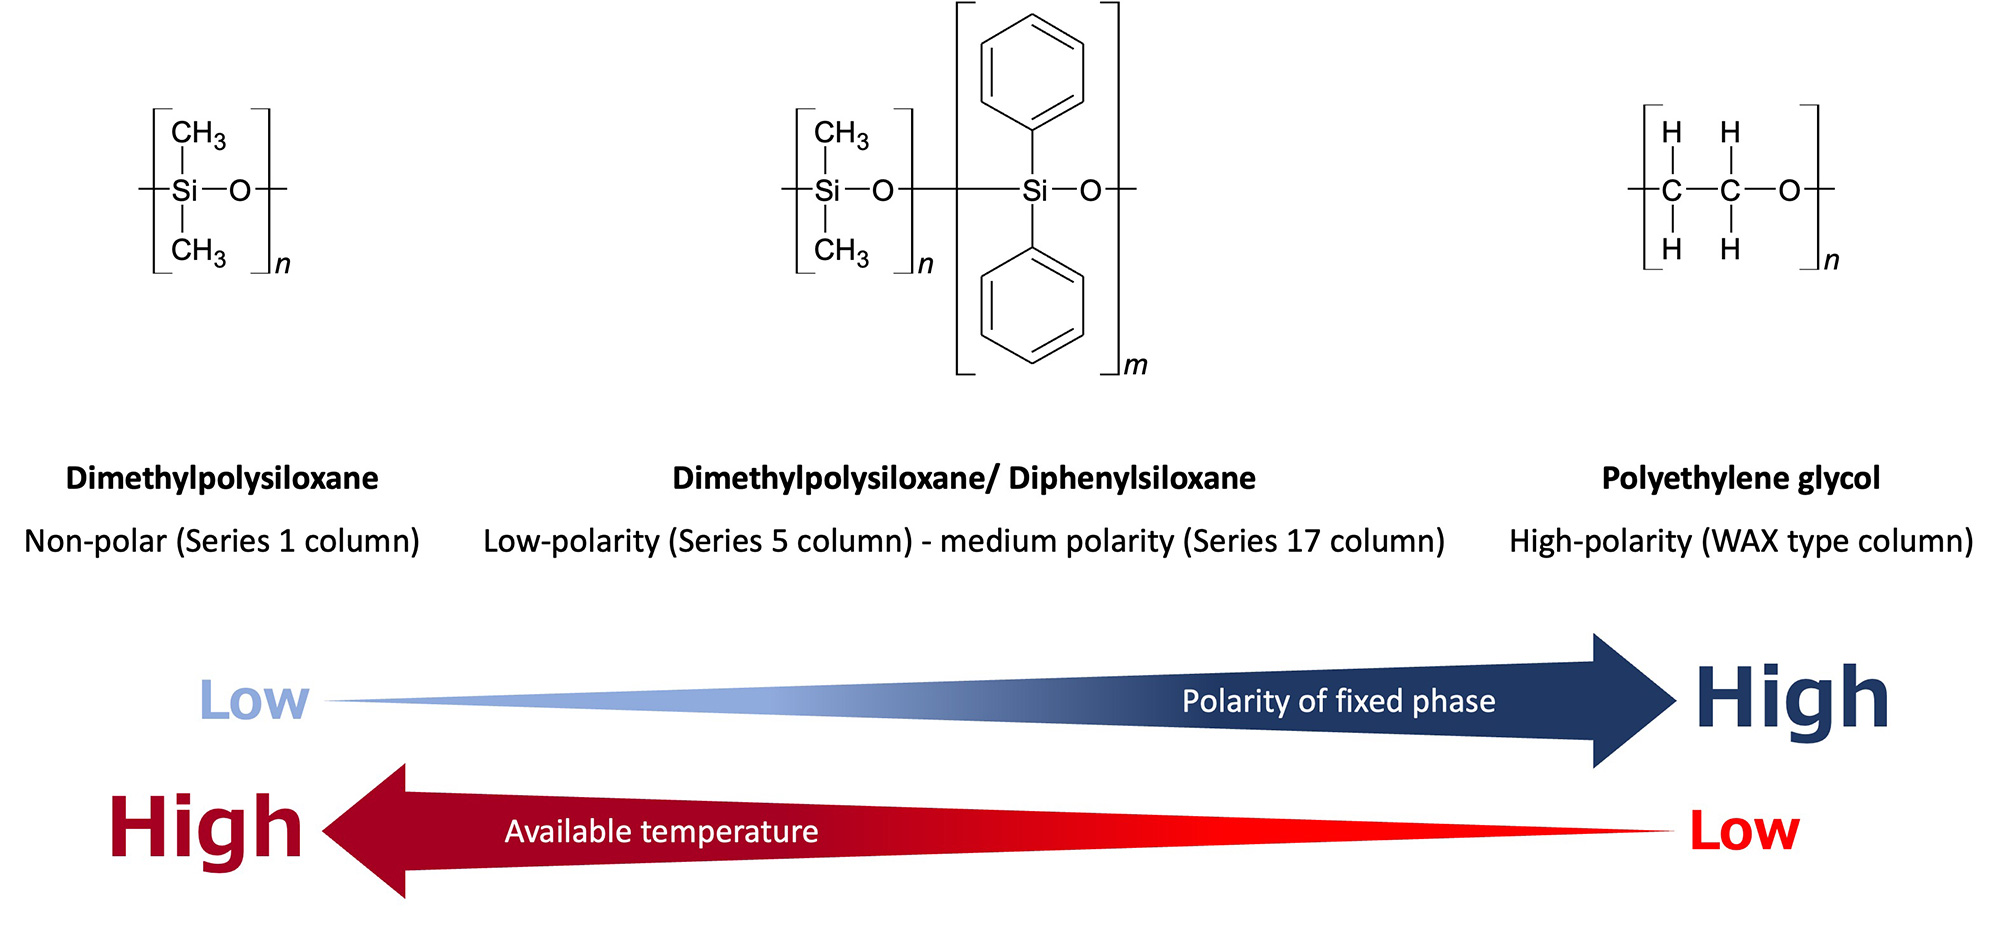
- Column length
Typically, column lengths of 20 to 60 m are used. For the same inner diameter, film thickness, and carrier gas linear velocity, a longer column provides better separation, but requires more analysis time. - Column inner diameter
Typically, an inner diameter of 0.18 to 0.53 mm is used. Using a column with a narrower i.d. will improve separation by narrowing the peak width, but it will also reduce the acceptable sample load, so it is necessary to use caution with the volume of sample injected. - Column film thickness
Thinner films result in shorter retention time and less column bleed. Thick film columns with high retention are used for low-boiling compounds.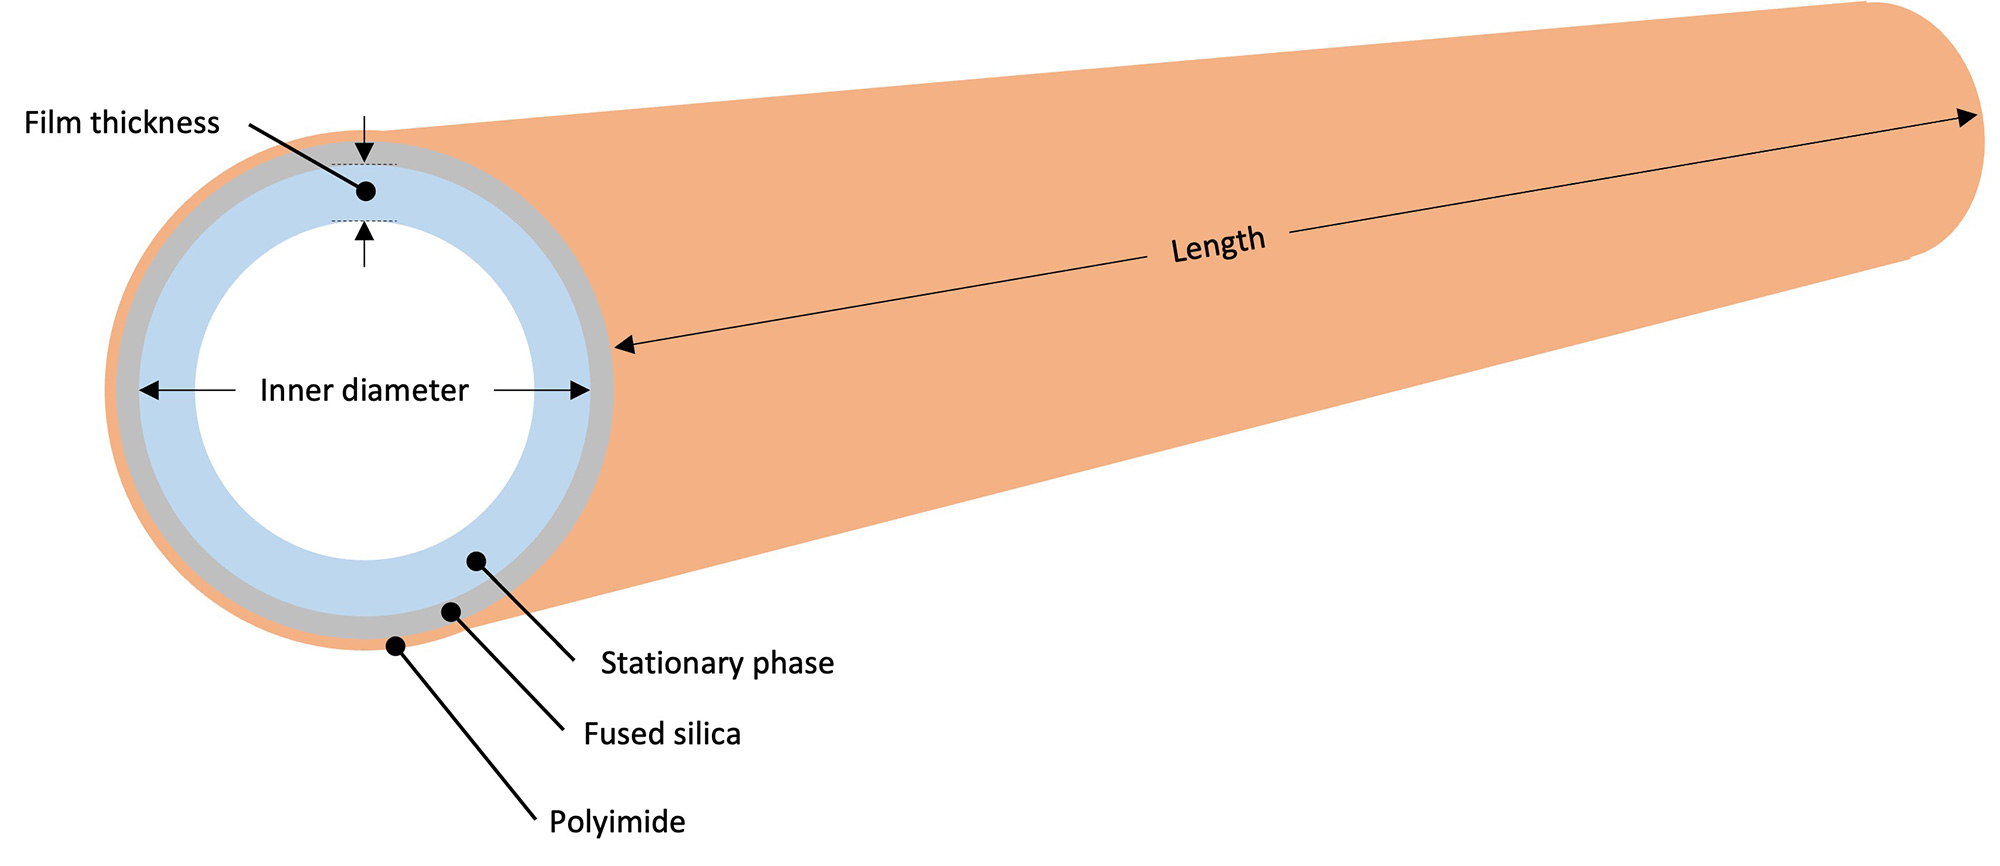
About Retention Index
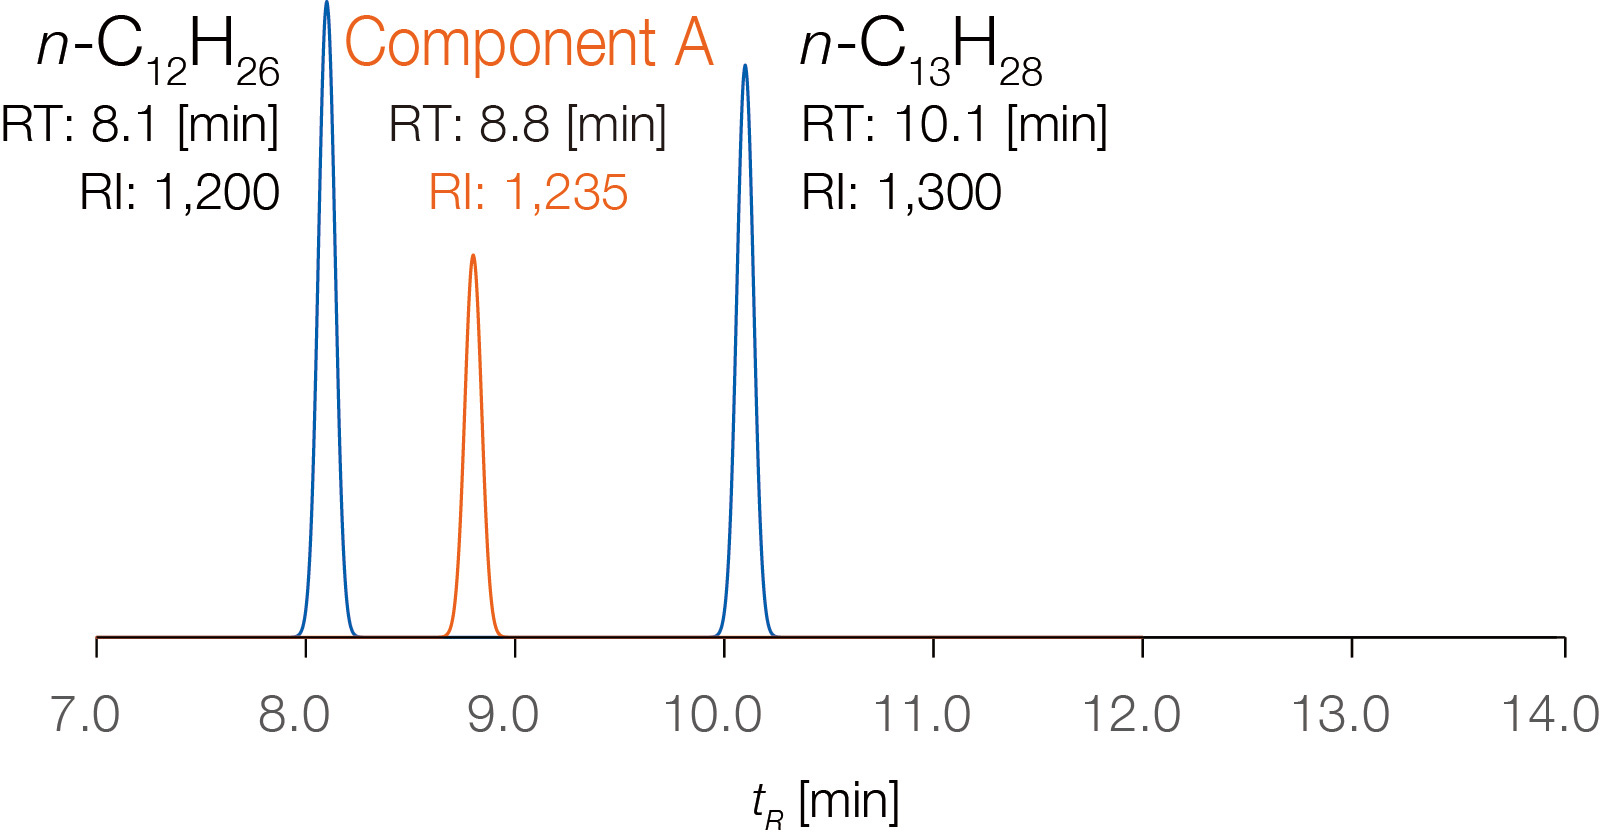
In gas chromatography (GC), the retention time of a specific compound varies depending on GC conditions, such as column inner diameter and length, stationary phase film thickness, temperature settings, and carrier gas flow rate. Therefore, when using retention time as a reference for compound identification, it is necessary to compare data obtained under strictly identical GC conditions. The Retention Index (RI) is a standardized measure of retention time based on straight-chain saturated hydrocarbons (n-alkanes) and is calculated using the following formula:
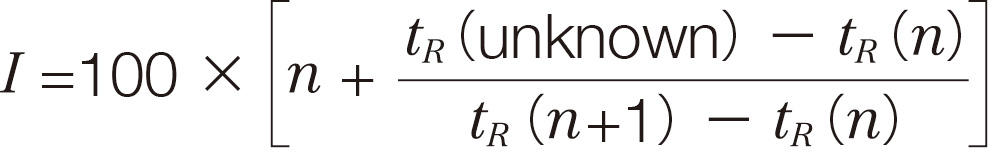
- tR (unknown) :
Retention time of the unknown compound - tR (n ) :
Retention time of the n-alkane with carbon number n that elutes before the unknown compound - tR (n +1) :
Retention time of the n-alkane with carbon number (n+1) that elutes after the unknown compound
Each compound has a unique RI value that does not depend on GC conditions,
making RI databases a powerful tool for compound identification. In the schematic
diagram on the right, the column temperature ramp rate is varied, and n-alkane
standards are measured under each condition to calculate the RI value of "Component
A." The RI value remains almost unchanged.
Although RI values are independent of GC operating conditions, they do depend on
the type of stationary phase used in the GC column. Therefore, when using an
RI database for compound identification, it is essential to analyze samples using
the
same stationary phase type as that used to generate the RI values in the database.
Column temperature ramp rate: 5 °C/min
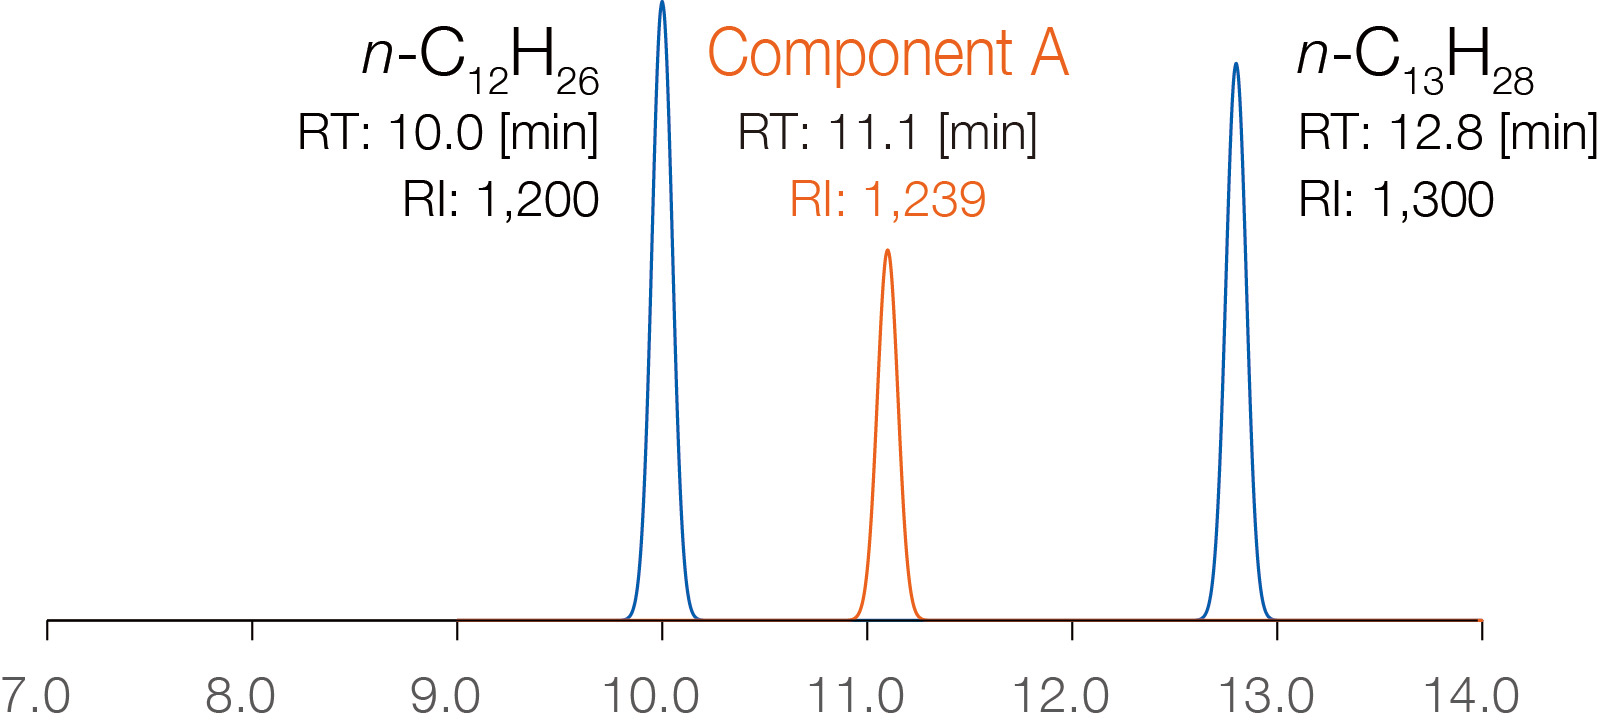
Column temperature ramp rate: 10 °C/min
Ionization Methods for GC-MS
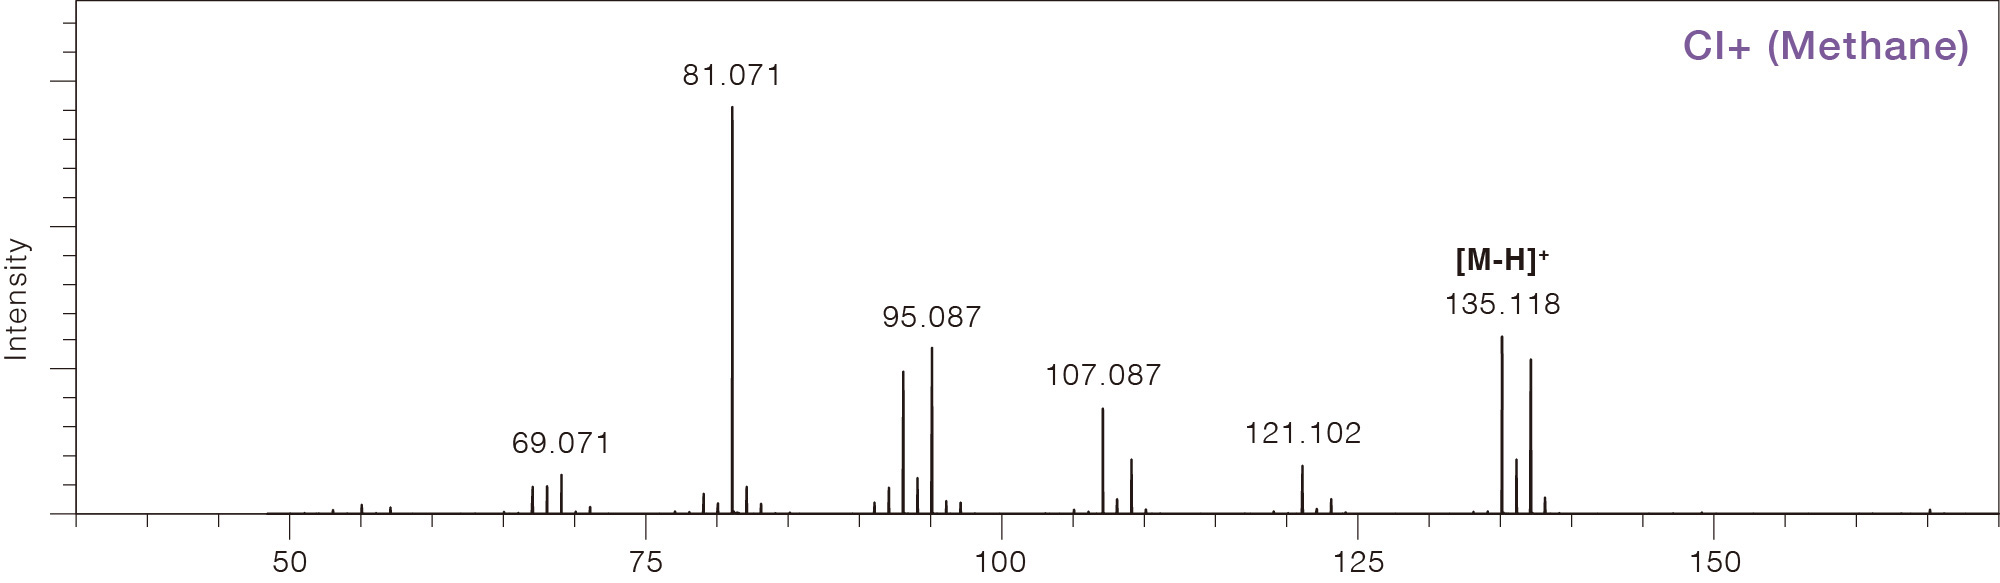
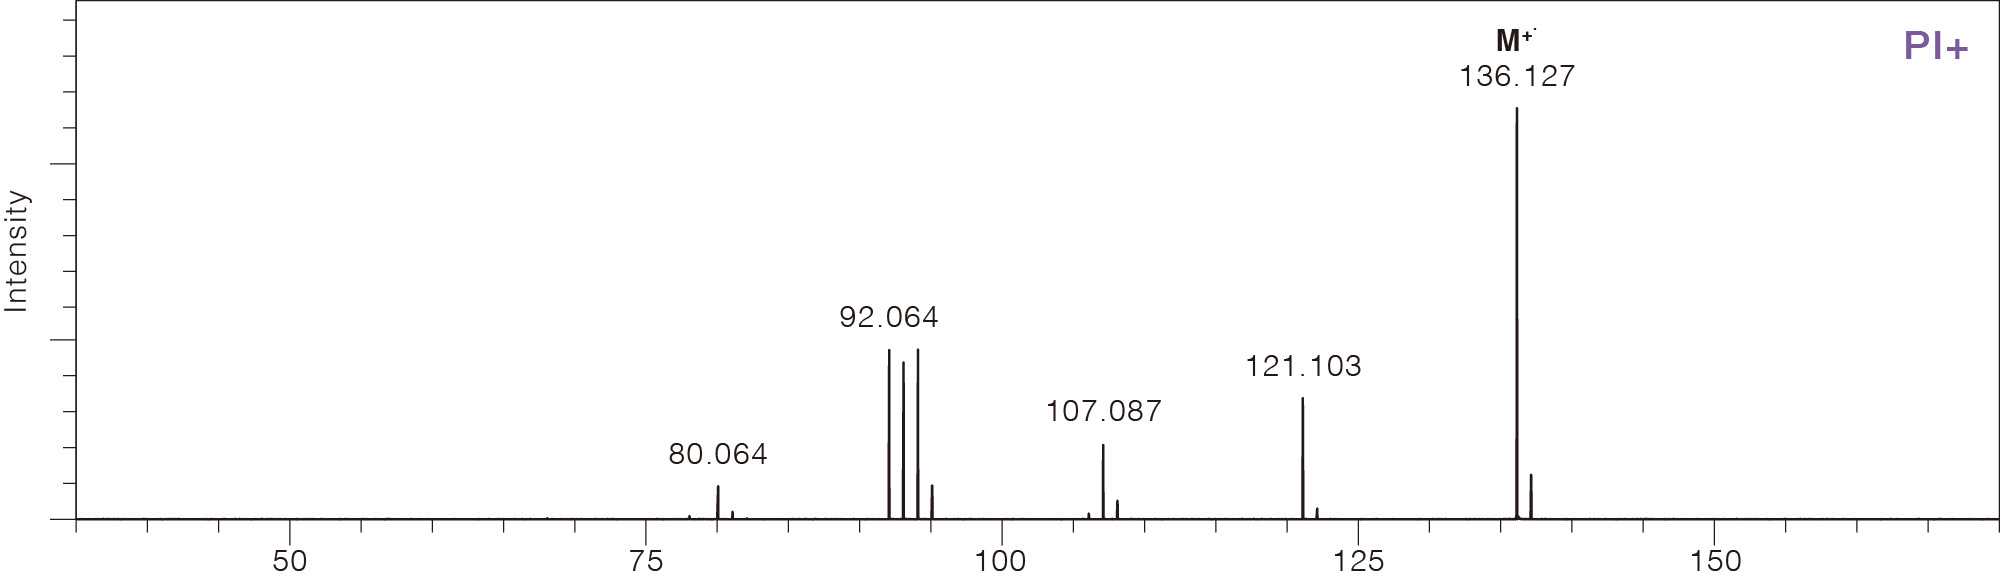
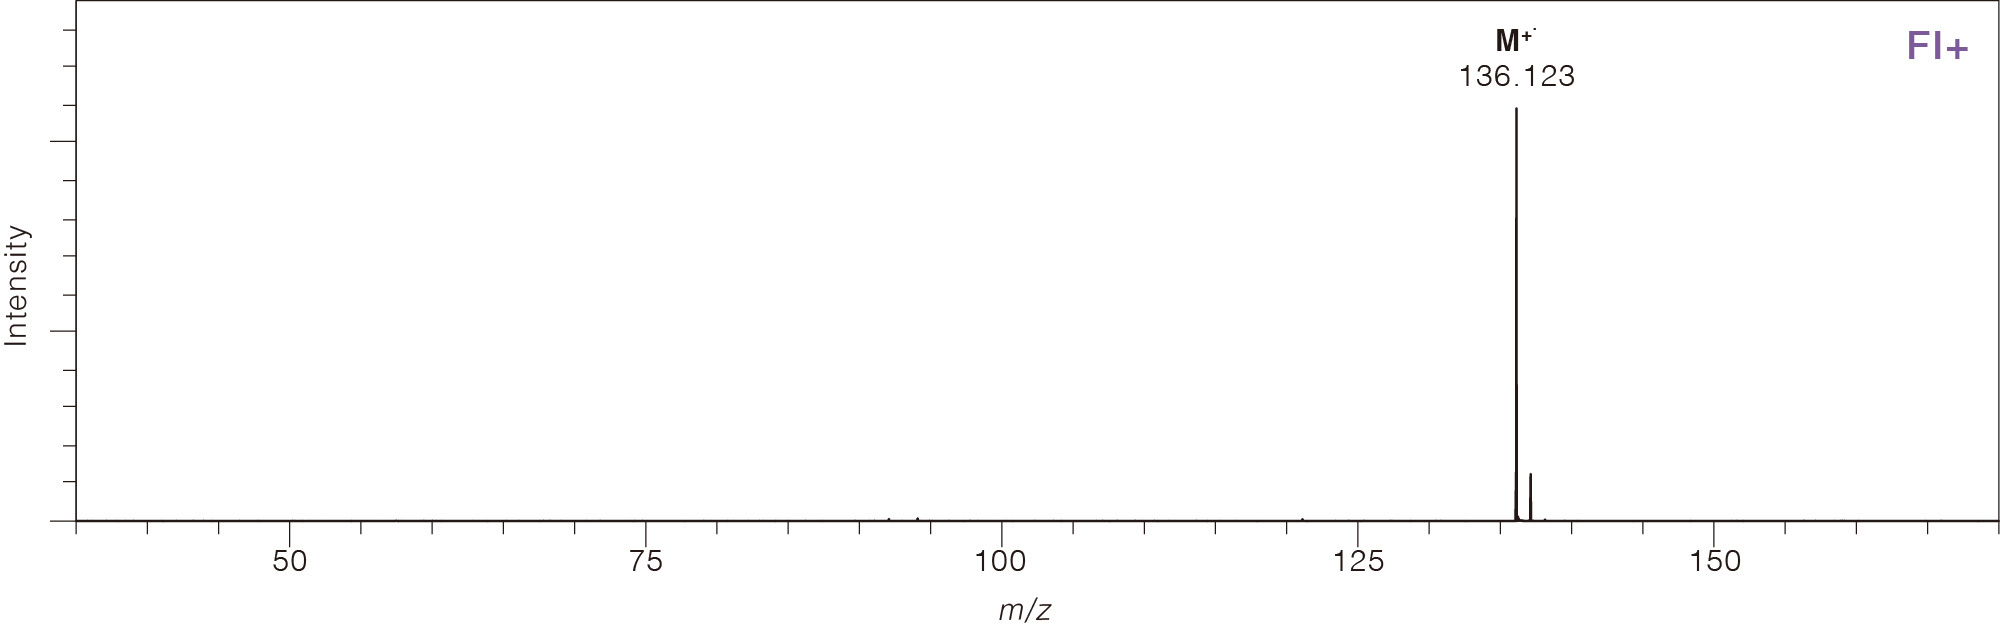
In addition to electron ionization (EI), ionization methods for volatile samples suitable for GC/MS include chemical ionization (CI), photoionization (PI), and field ionization (FI). With EI, there are some compounds whose molecular weight is difficult to confirm. CI, PI and FI are effective for analyzing such compounds.
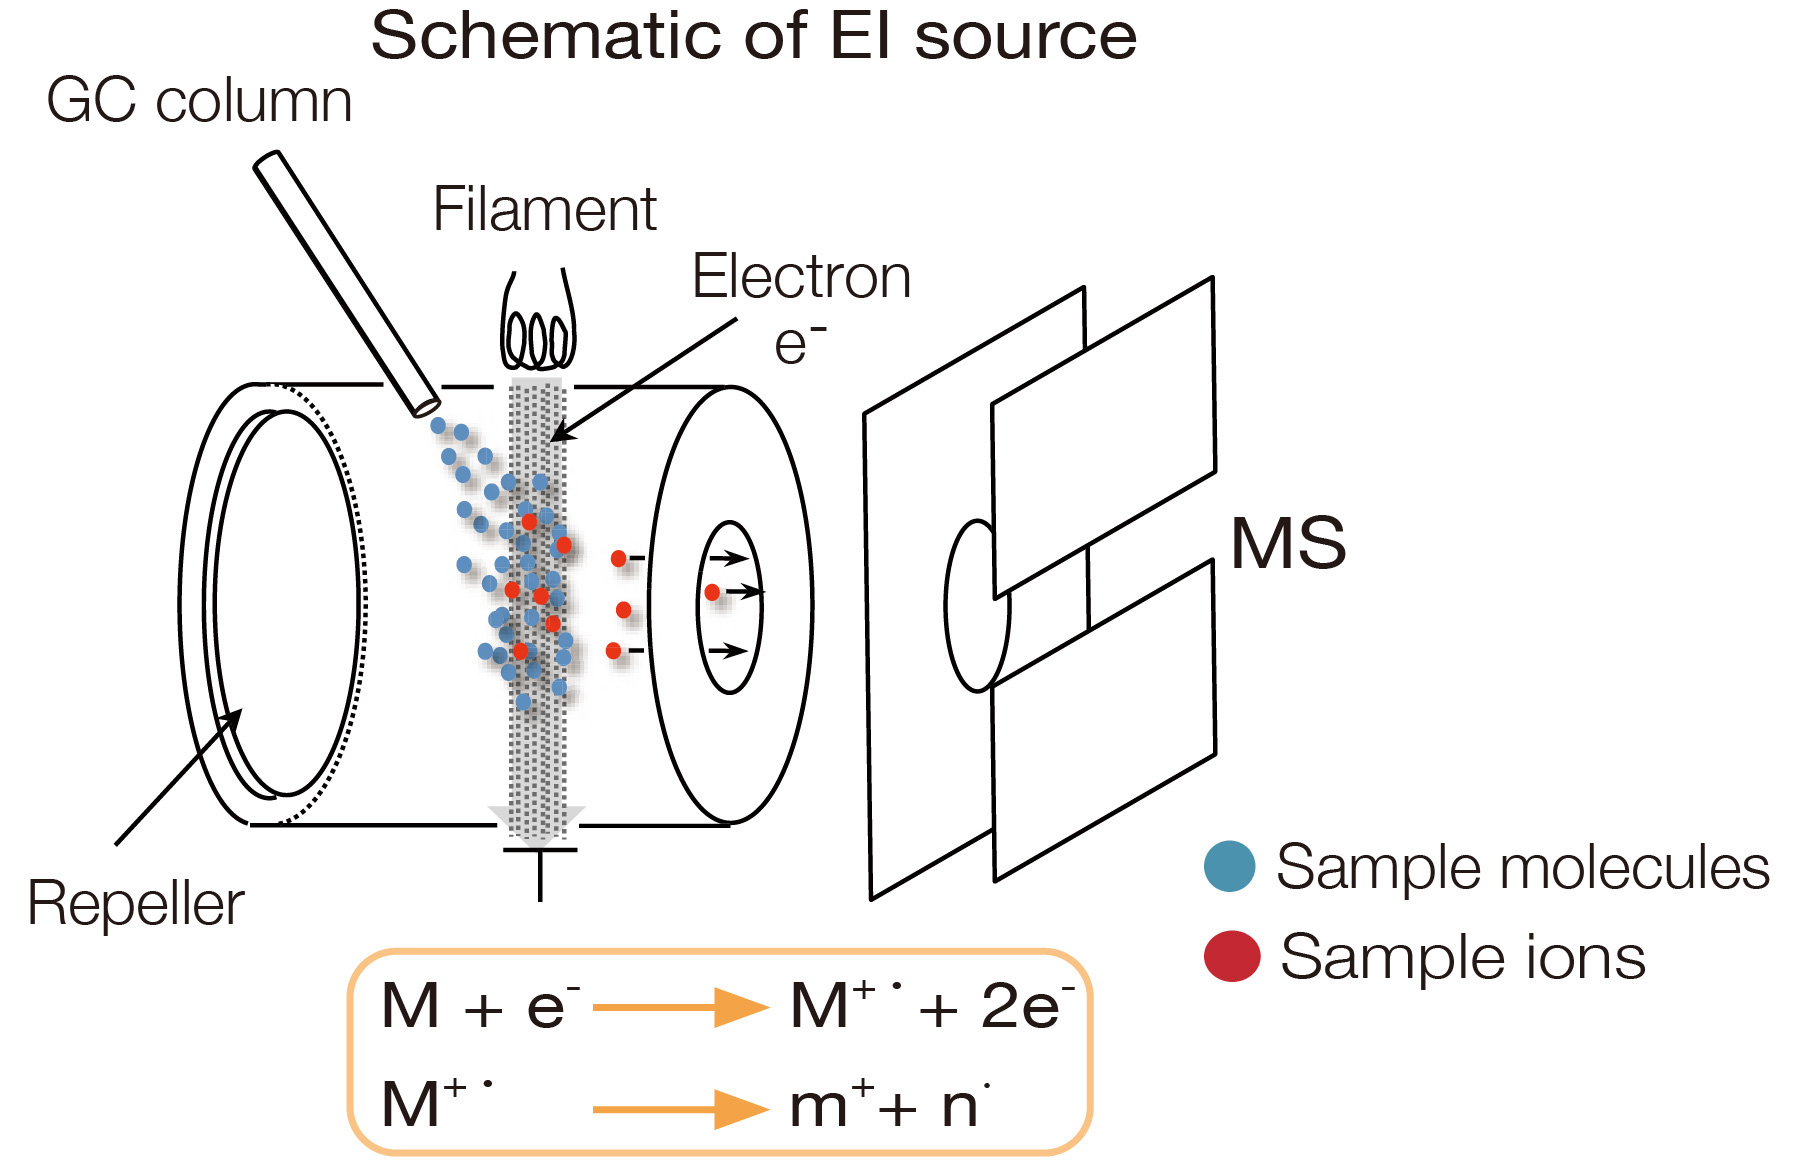
Electron Ionization (EI)
This is the ionization method most widely used for GC-MS. A thermal filament emits high-energy electrons that collide with gas-phase molecules to produce ions. The gas-phase requirement for ionization makes EI readily compatible with gas chromatography (GC) sample introduction. Ion/electron collisions can produce many fragment ions ("hard ionization"). Because the relative intensity of each ion observed (spectral pattern) has high reproducibility, components can be identified by comparing the acquired spectrum against EI mass spectrum library databases. More than 300,000 compounds from multiple databases are available with measured EI spectra, supporting various GC-MS applications.
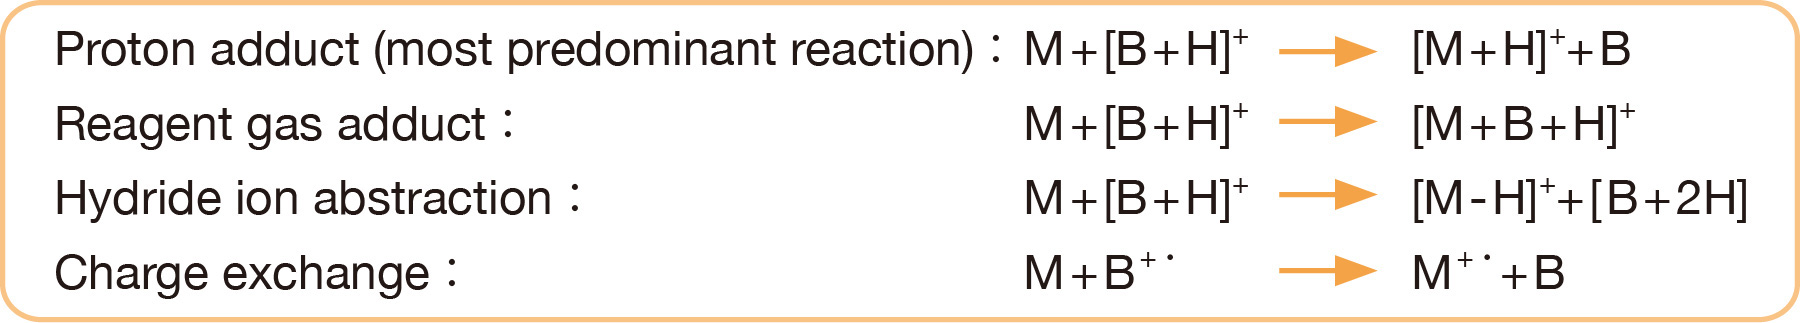
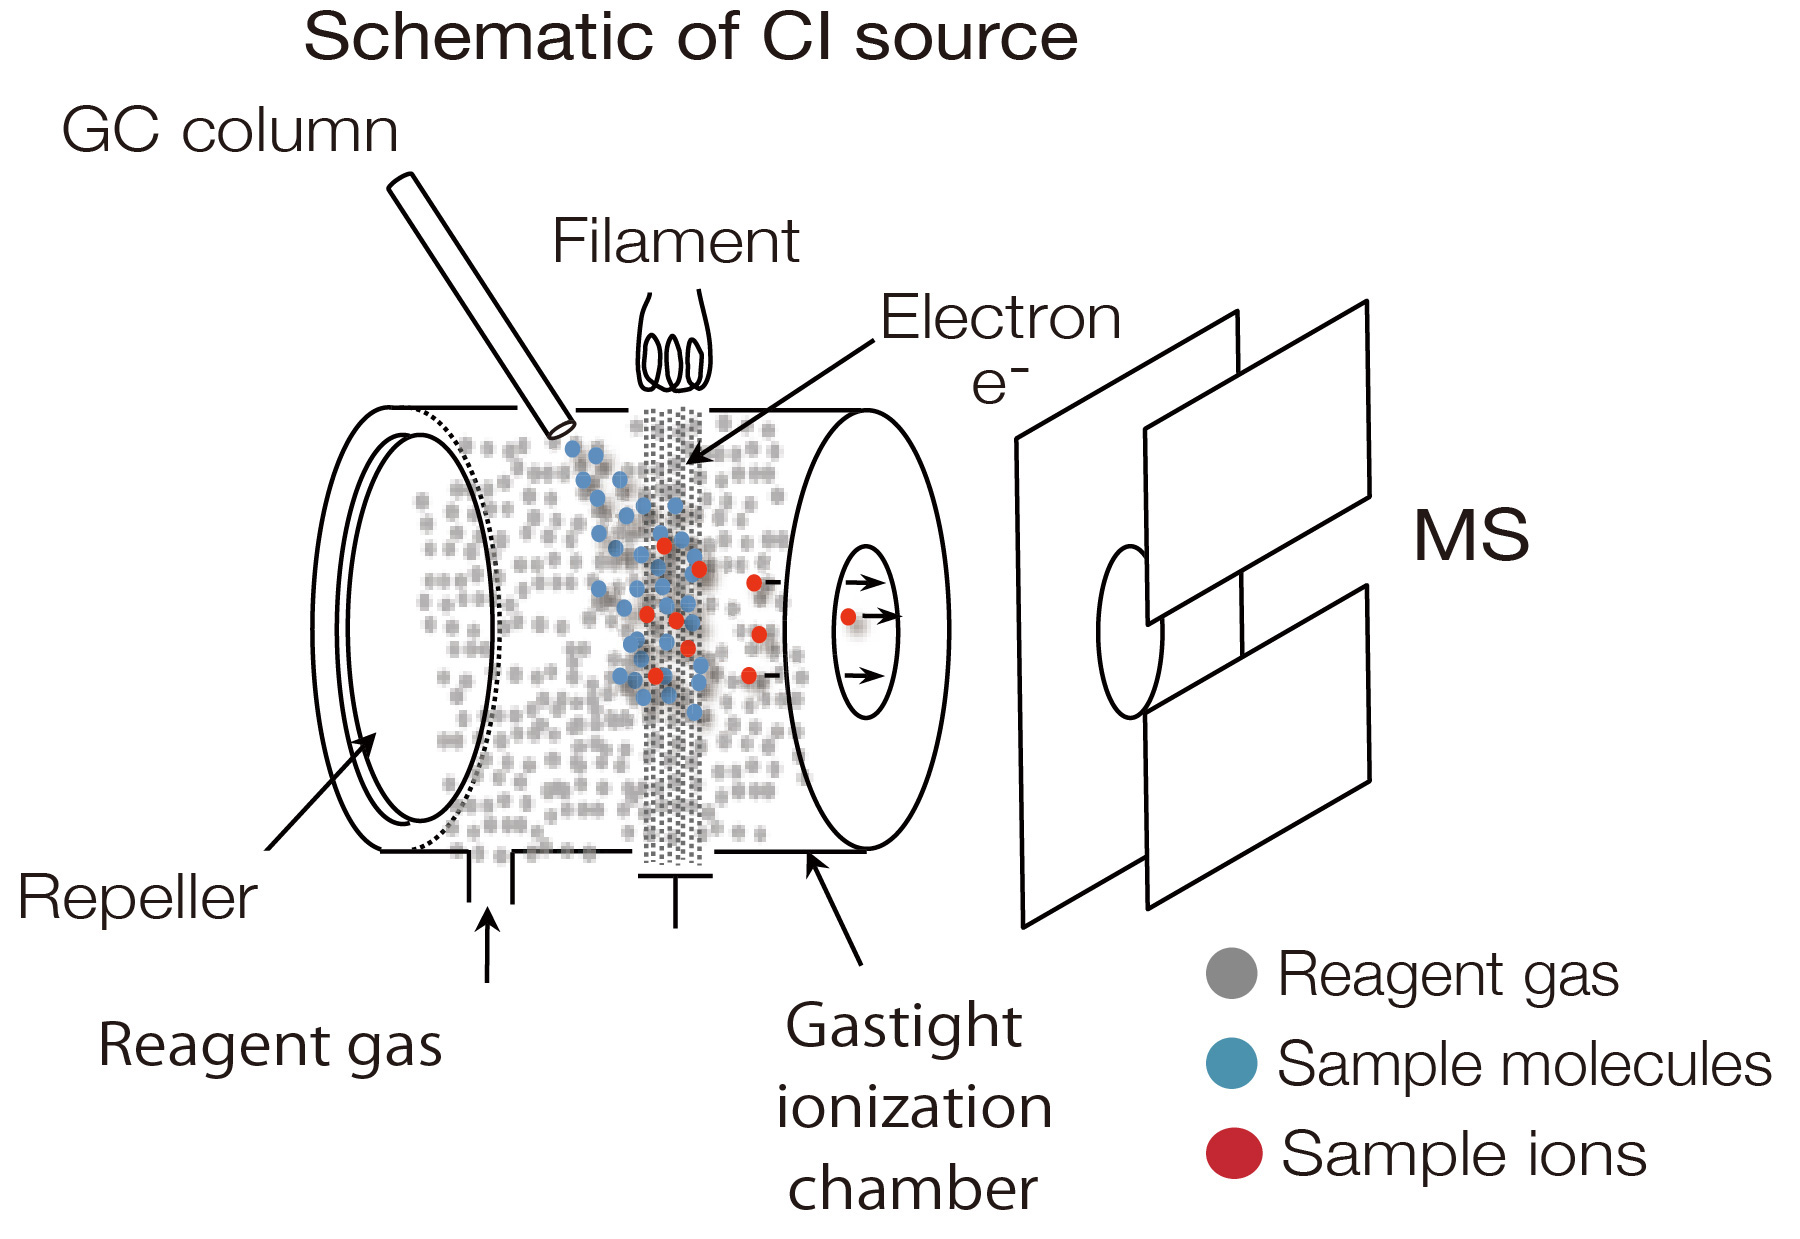
Chemical Ionization (CI)
This is a common soft ionization method used for GC-MS. A reagent gas is introduced
into a highly
gastight ionization chamber (approx. 10-2 Pa), and the reagent gas is
ionized by thermal electrons.
Reagent gas ions undergo ion-molecule reactions with sample molecules to produce
protonated
molecules, adducts, and fragments. Compared to EI, CI produces fewer fragments
("soft ionization")
and provides information about the sample elemental composition. Methane, isobutane,
and ammonia are commonly used as reagent gases. Methane and isobutane typically
produce
protonated molecules [M + H]+, while ammonia produces ammonium adducts [M
+ NH4]+.
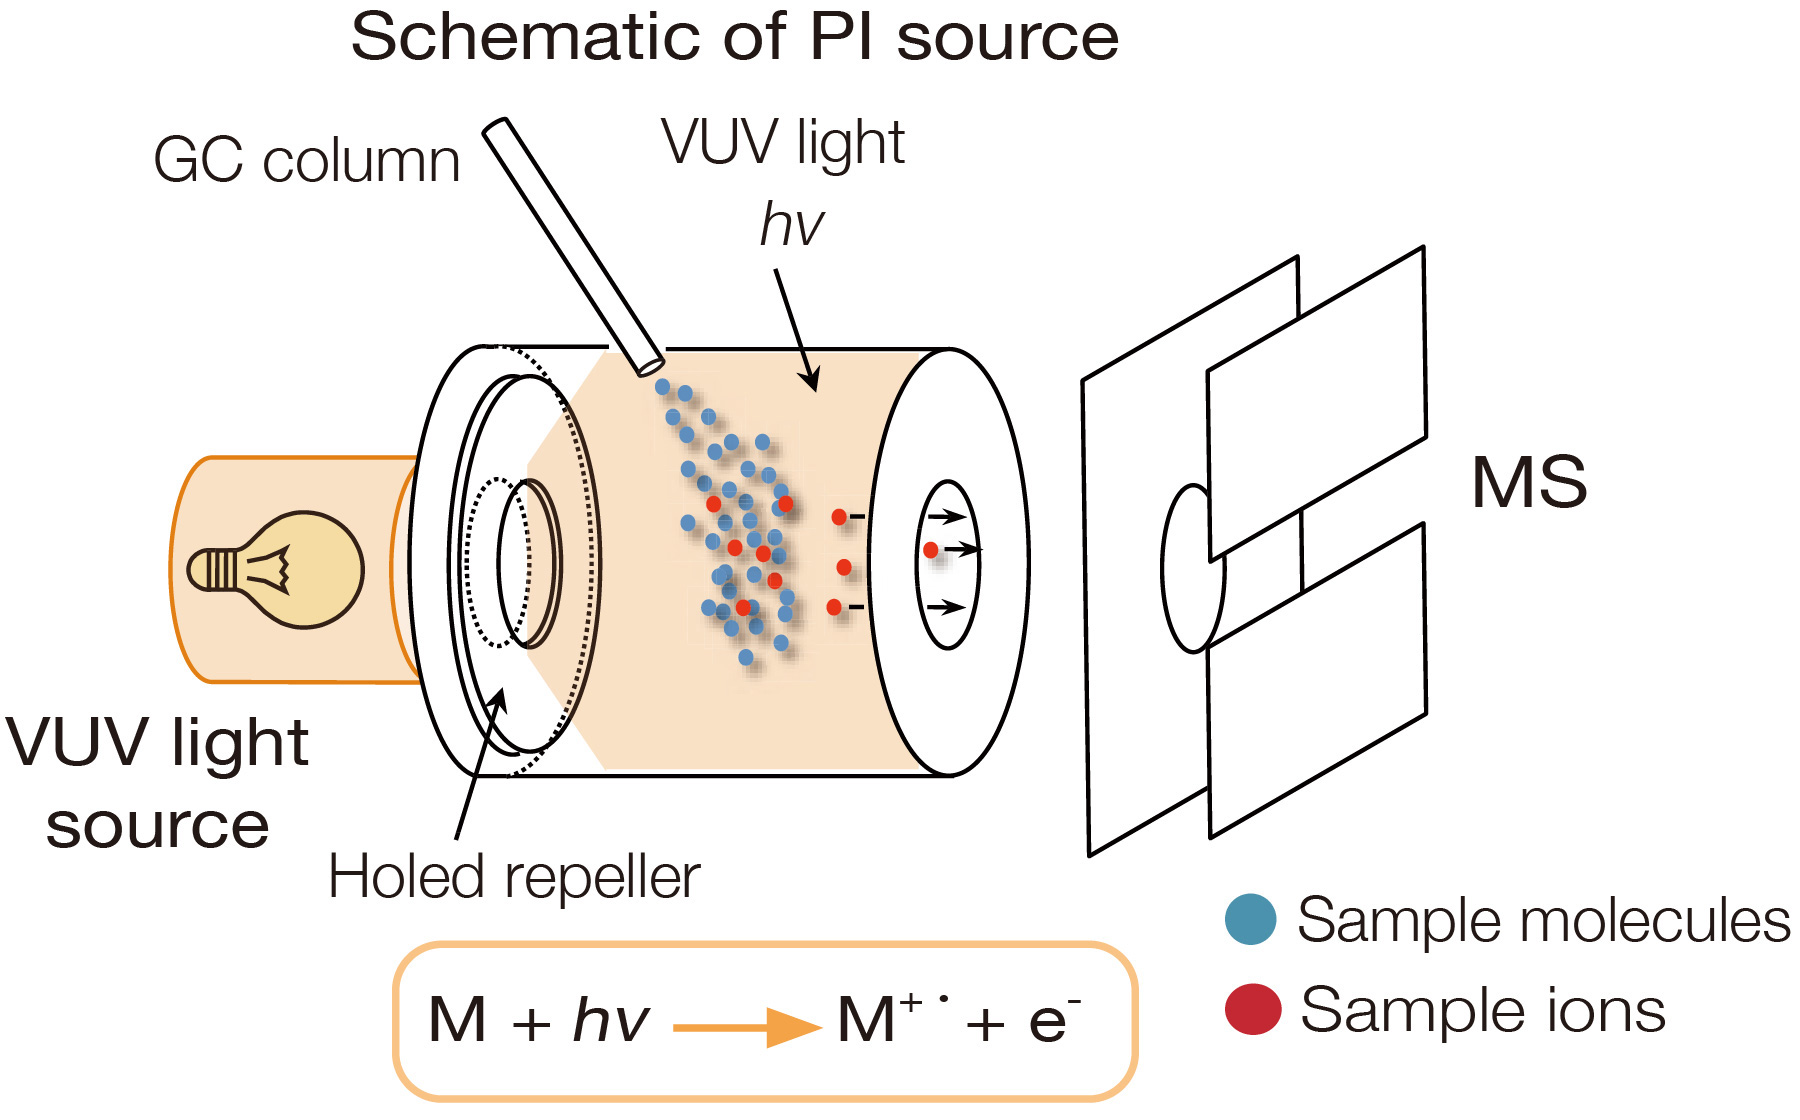
Photoionization (PI)
Photoionization uses vacuum ultraviolet (VUV) light with a photon energy at 8 to 10 eV to irradiate and ionize sample molecules. Because the photon energy is just above the ionization energy for typical organic compounds (8 to 11 eV), PI is a soft ionization method resulting in minimal fragmentation. Compounds that absorb ultraviolet light, such as aromatic compounds, tend to have higher sensitivity compared to other compounds. Photoionization is a soft ionization method for GC-MS that does not require a reagent gas. It is easy to use and is effective in determining the elemental composition of an unknown compound.
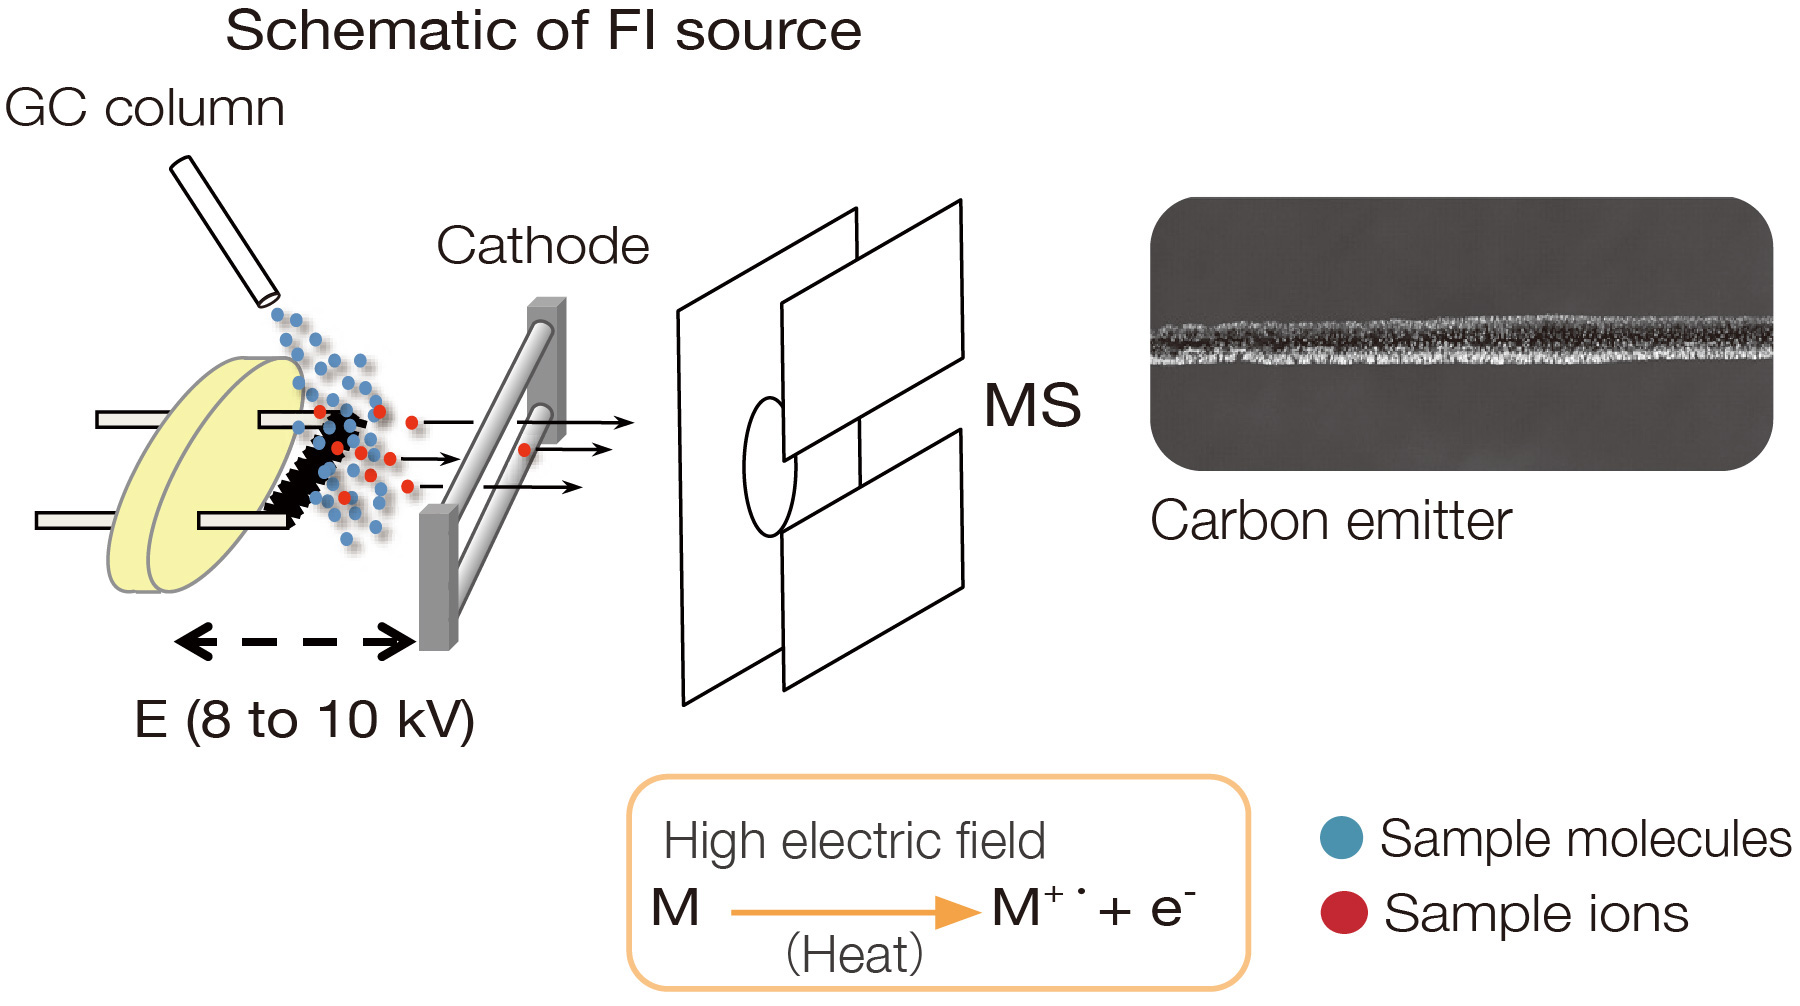
Field Ionization (FI)
In field ionization, a high electrical potential (8 to 10 kV) is applied
between a wire emitter coated with dendritic carbon microneedles and a
counter electrode (cathode). Electron tunneling produces molecular ions
when sample molecules are exposed to the high electric field at the
sharp tip of each microneedle. The internal energy imparted into
sample molecules during the ionization process is 1 eV or less, which is
considerably smaller than that of the EI, CI, and PI methods, and results
in minimal fragmentation. Although FI primarily produces molecular ions,
protonated molecules are also possible for highly polar compounds. In
practice, FI is used with GC-MS to ionize gaseous sample molecules as
they elute from the GC column.
Field ionization is available for JEOL AccuTOF™ GC series GC-TOFMS systems.
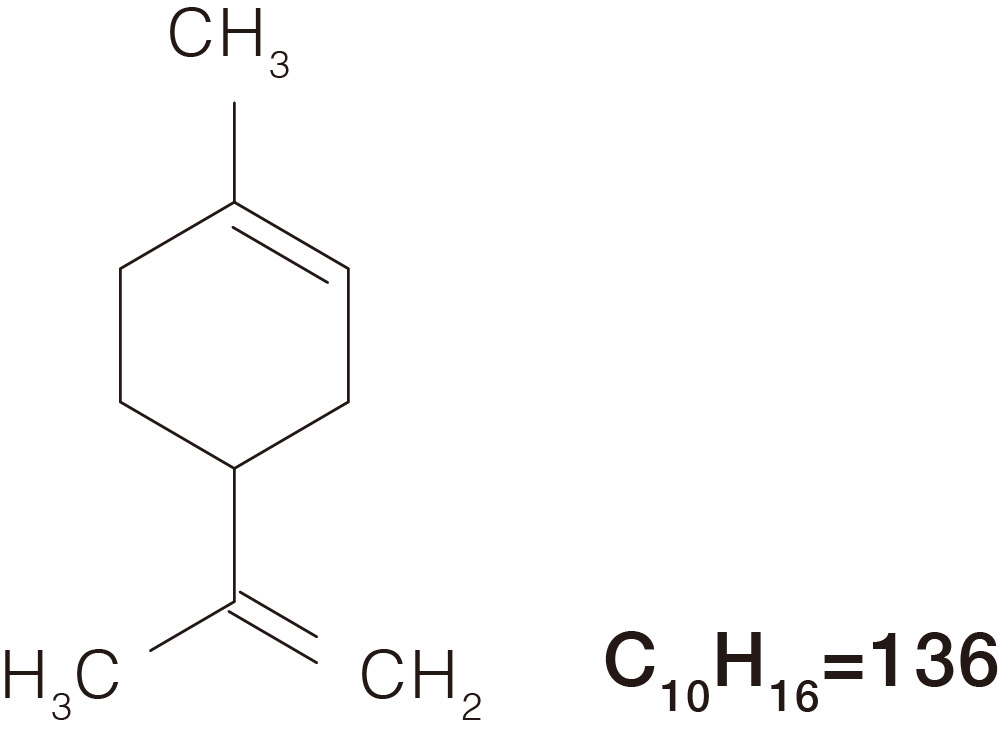
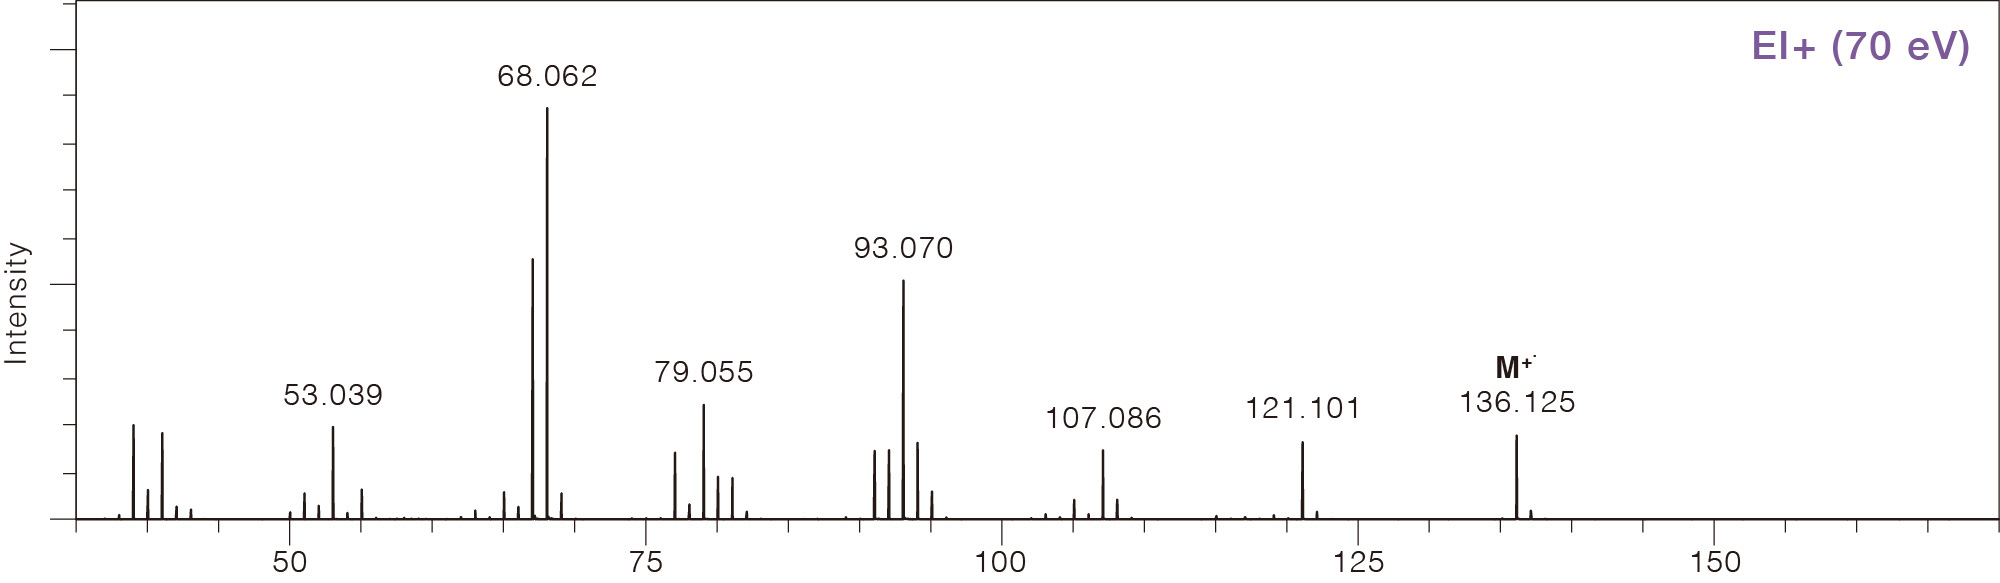
Comparison of Mass Spectra Across Different Ionization Methods
Limonene
CAS No.138-86-3
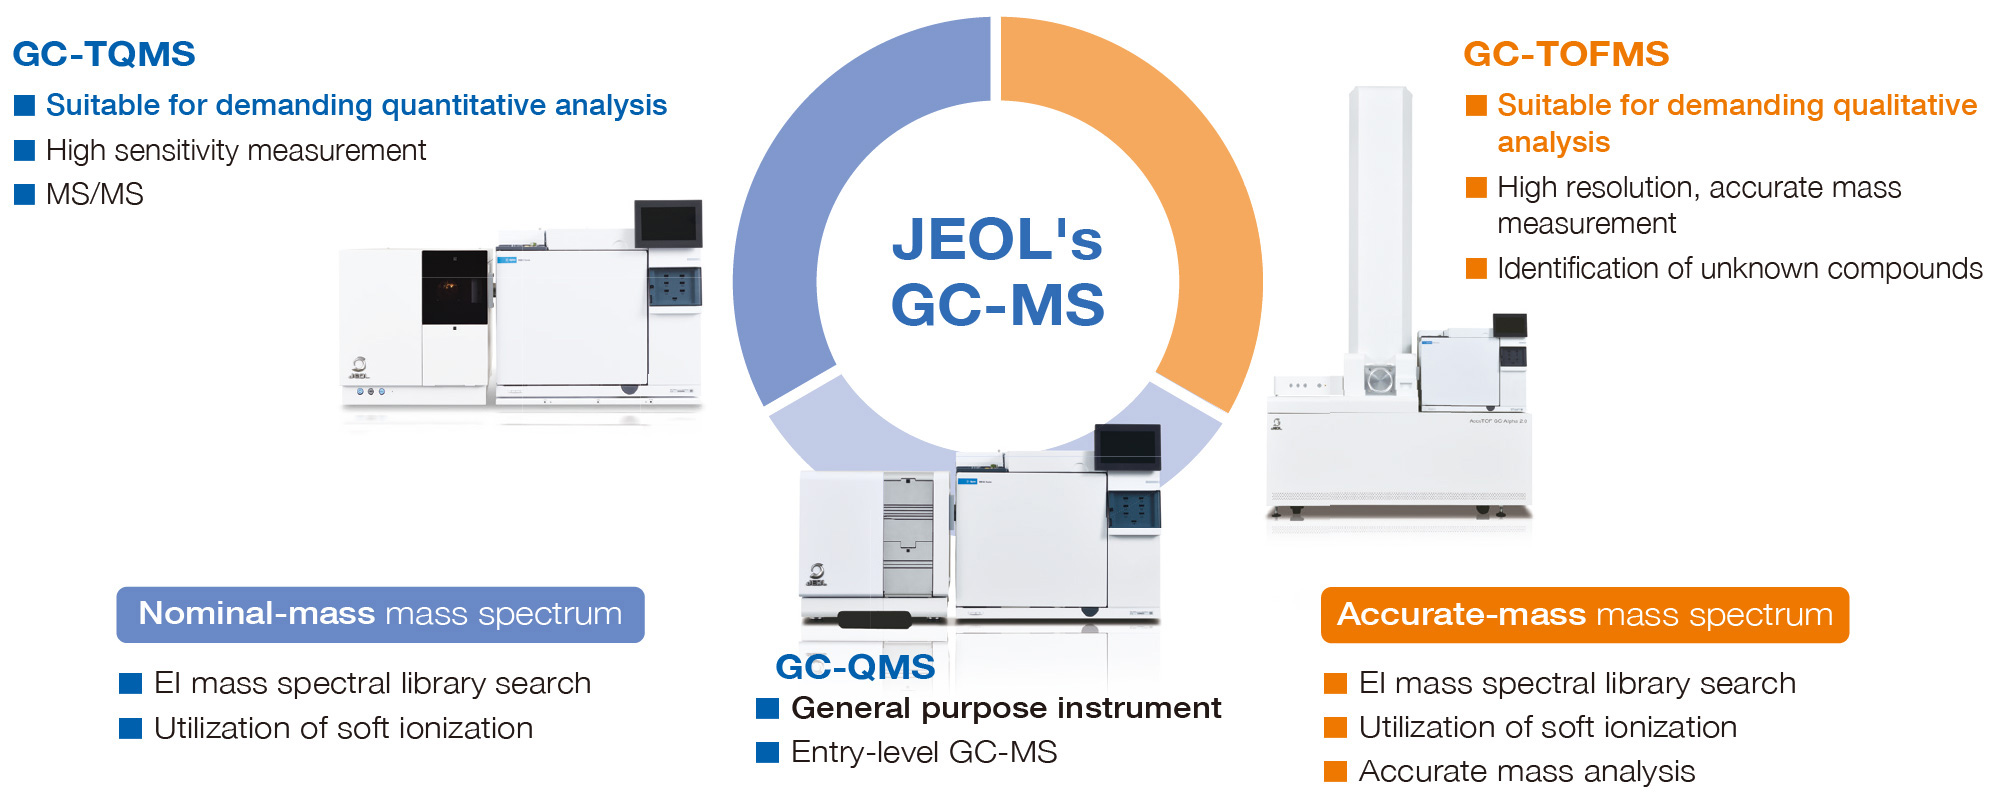
About MS for GC-MS
The mass spectrometers used in GC-MS include Quadrupole Mass Spectrometer (QMS), Triple Quadrupole Mass Spectrometer (TQMS), and Time-of-Flight Mass Spectrometer (TOFMS).
[QMS]
This instrument is easy to operate, robust and versatile, making it suitable for routine
analysis.
[TQMS]
This instrument, allowing for two-step mass separation by tandem mass spectrometry (MS/MS),
has
high selectivity and it is suitable for the quantitative analysis of samples with complex
matrices and interferences.
[TOFMS]
Majority of TOFMS's (including JEOL's) have high mass resolving power and high mass
accuracy,
and are capable of elemental composition elucidation by accurate mass measurement. A high
mass-resolution TOFMS can identify unknown compounds without relying on a library search and
is
suitable for non-target analysis.
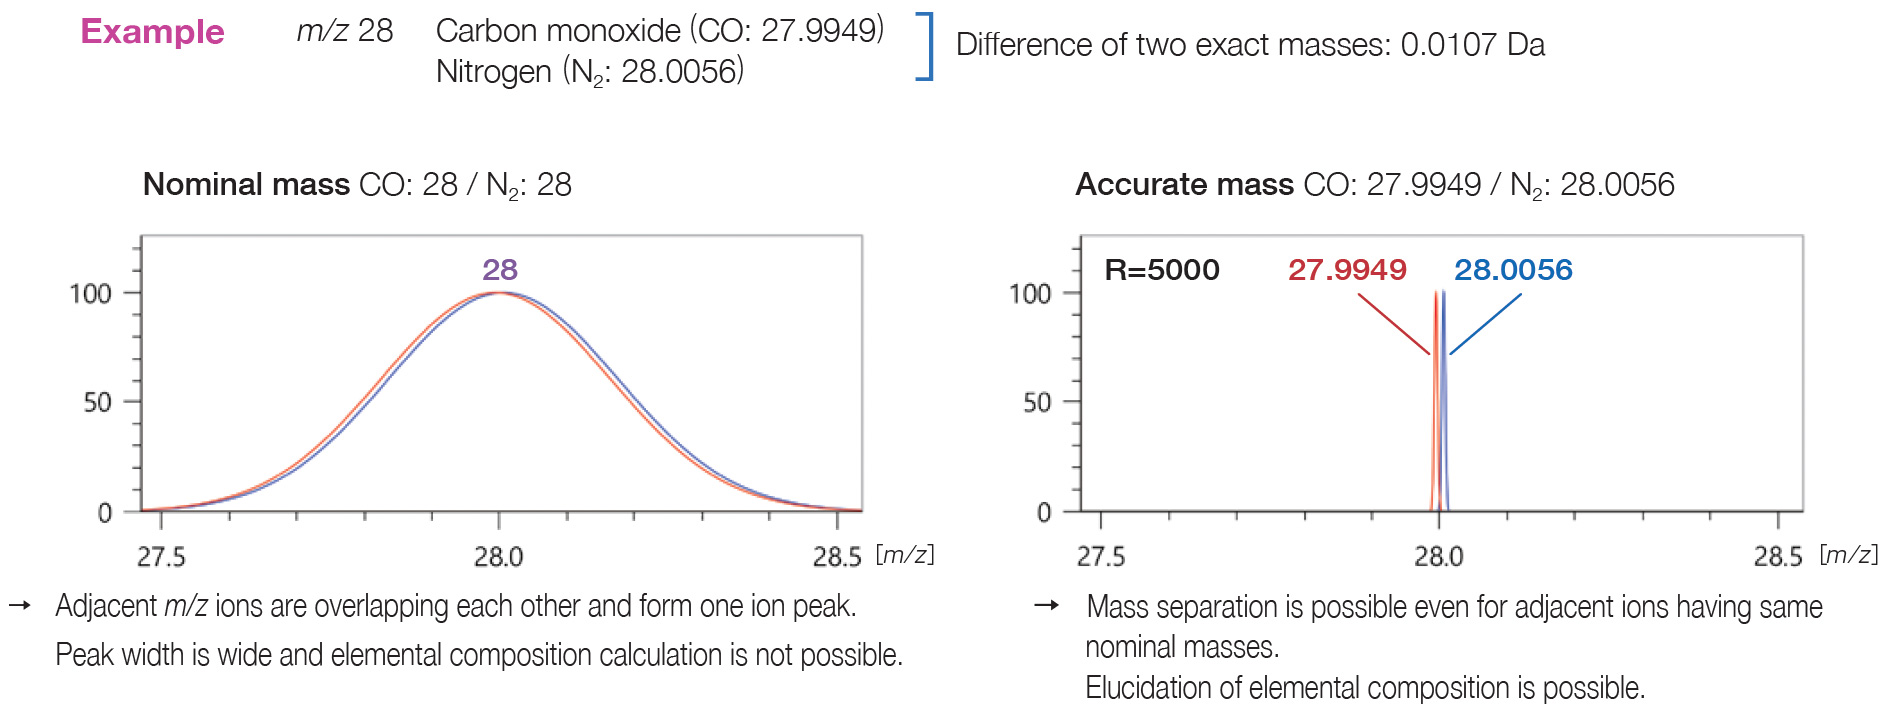
Differences between data obtained by QMS/TQMS and TOFMS
While QMS and TQMS can measure nominal mass, TOFMS has a mass
resolution
that provides mass accuracy in the order of 1/1000.
When accurate mass analysis is
required,
high resolution TOFMS is an optimal choice.
Differences between QMS/TQMS and TOFMS data acquisition methods
QMS/TQMS uses a transmission quadrupole mass analyzer to separate ions, and switches between scan mode and SIM mode depending on the purpose. TOFMS always acquires a mass spectrum.
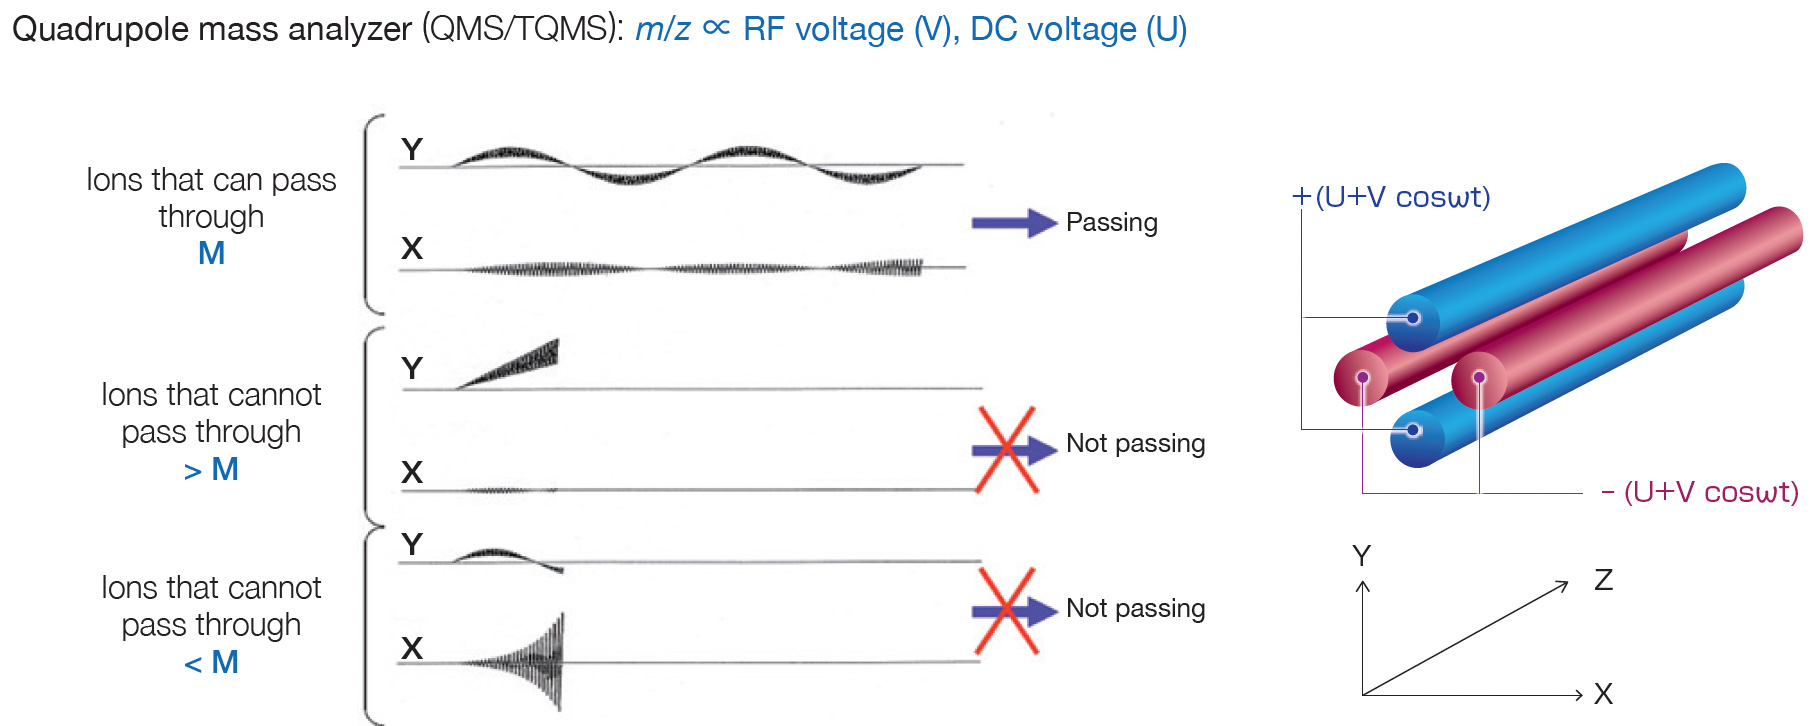
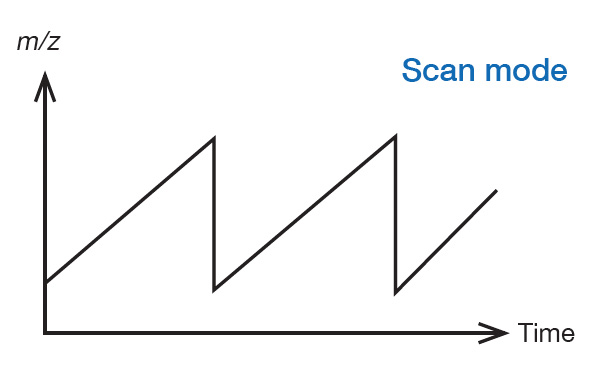
Scan mode
In the transmission quadrupole mass analyzer, by appropriately setting the RF voltage (V) and DC voltage (U) applied to the quadrupole, only ions with a specific m/z can be transmitted. Mass spectra can be sequentially obtained by repeatedly scanning the RF voltage (V) and DC voltage (U) while maintaining the ratio of V and U constant. From the data obtained, the mass spectrum at any time and the EIC of any m/z can be obtained, as shown in P. 2. Qualitative analysis (identification) of a compound can be performed from the mass spectrum, and quantitative analysis can be performed from EIC.
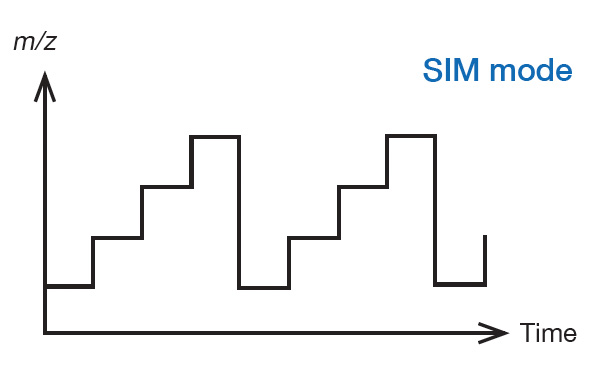
SIM (Selected Ion Monitoring) mode
Measurement is performed by repeatedly changing the RF voltage (V) and DC voltage (U) in a stepwise manner so that one or more preset m/z ions can be sequentially transmitted. High sensitivity can be obtained because the time during which a specific m/z ion is transmitted is much longer than in scan mode. The data obtained consists only in chromatograms of pre-specified m/z ions (SIM chromatograms) and cannot be used for qualitative analysis. This data is used for quantitative analysis of trace substances whose sensitivity is insufficient in scan mode.
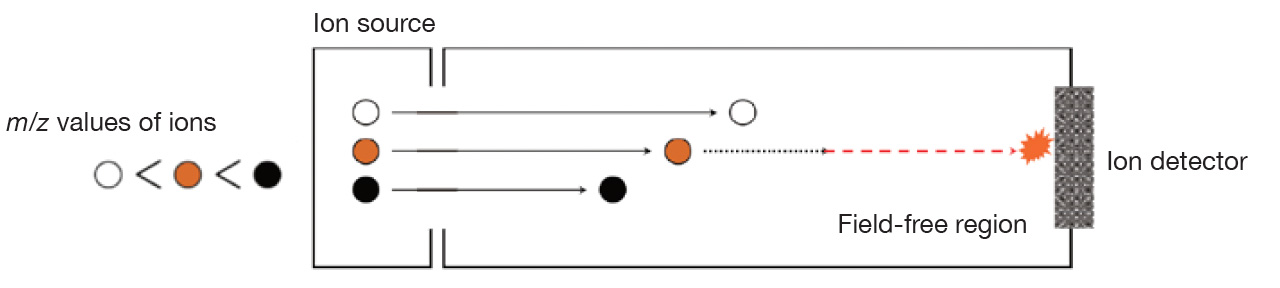
Time-of-Flight Mass Spectrometer: m/z ∝ [time-of-flight]2
When ions with different m/z are accelerated at the same voltage at the same time, all the ions acquire the same kinetic energy and fly in a field-free region. Smaller m/z ions fly faster, and larger m/z ions fly slower, so mass spectra can be obtained by sequentially detecting the ions that reach the detector. Since a single ion flight cycle can be completed in tens of microseconds to hundreds of microseconds, it is possible to measure more than 10,000 mass spectra per second, but in reality, an appropriate number of mass spectra are summed and then recorded. It is possible to record up to 50 mass spectra per second.
GC-MS Qualitative Analysis
The first step in GC/MS qualitative analysis is to search the NIST mass spectral library. When it is difficult to judge whether molecular ions are present in the EI mass spectrum or not, you can improve confidence in identification by detecting molecular ions from soft ionization data. However, for unknown compounds, conclusive identification can be difficult. By performing accurate mass analysis, we are able to know the elemental composition (its molecular formula) and opt for further structural analysis.
Advantage of integrated qualitative analysis
In qualitative analysis by GC-MS, it is common to perform a library search using mass spectra obtained by the Electron Ionization (EI) method. The following figures and table show the EI and Soft Ionization (SI) mass spectra of component A, and the results of the library search using the EI mass spectrum. The library search results show that all of the candidates have a high similarity score of more than 800. In most cases, component A will be determined to be the first candidate with the highest similarity score in the library search when qualitative analysis is performed using only the EI mass spectrum. However, m/z 314, which is presumed to be a molecular ion, has been detected in the SI mass spectrum. Therefore, component A can be presumed to be the second candidate "Diethylene glycol dibenzoate". In JEOL Ltd., we call the combination of the library search using EI mass spectrum and analysis of molecular ions in the SI mass spectrum an "integrated qualitative analysis". The msFineAnalysis iQ is a software that can perform this integrated qualitative analysis automatically.
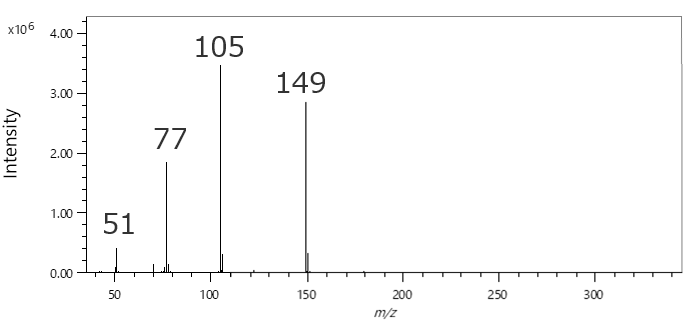
EI mass spectrum of component A
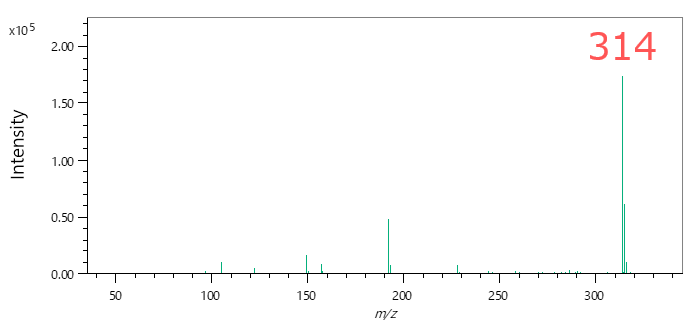
SI mass spectrum of component A
| No. | Library Name | Similarity | Formula | MW |
|---|---|---|---|---|
| 1 | 2,2'-(Ethane-1,2-diylbis(oxy))bis(ethane-2,1-diyl) dibenzoate | 828 | C20 H22 O6 | 358 |
| 2 | Diethylene glycol dibenzoate | 821 | C18 H18 O5 | 314 |
| 3 | Benzoic acid, 2-(3-nitrophenyl)ethyl ester | 810 | C15 H13 N O4 | 271 |
| 4 | 1,3-Dioxolane, 2-(methoxymethyl)-2-phenyl- | 802 | C11 H14 O3 | 194 |
| 5 | 3,6,9,12-Tetraoxatetradecane-1,14-diyl dibenzoate | 800 | C24 H30 O8 | 446 |
The library search results of component A (Top 5 candidates)
Integrated qualitative analysis can be performed automatically and easily using software.
Qualitative analysis for unknown components
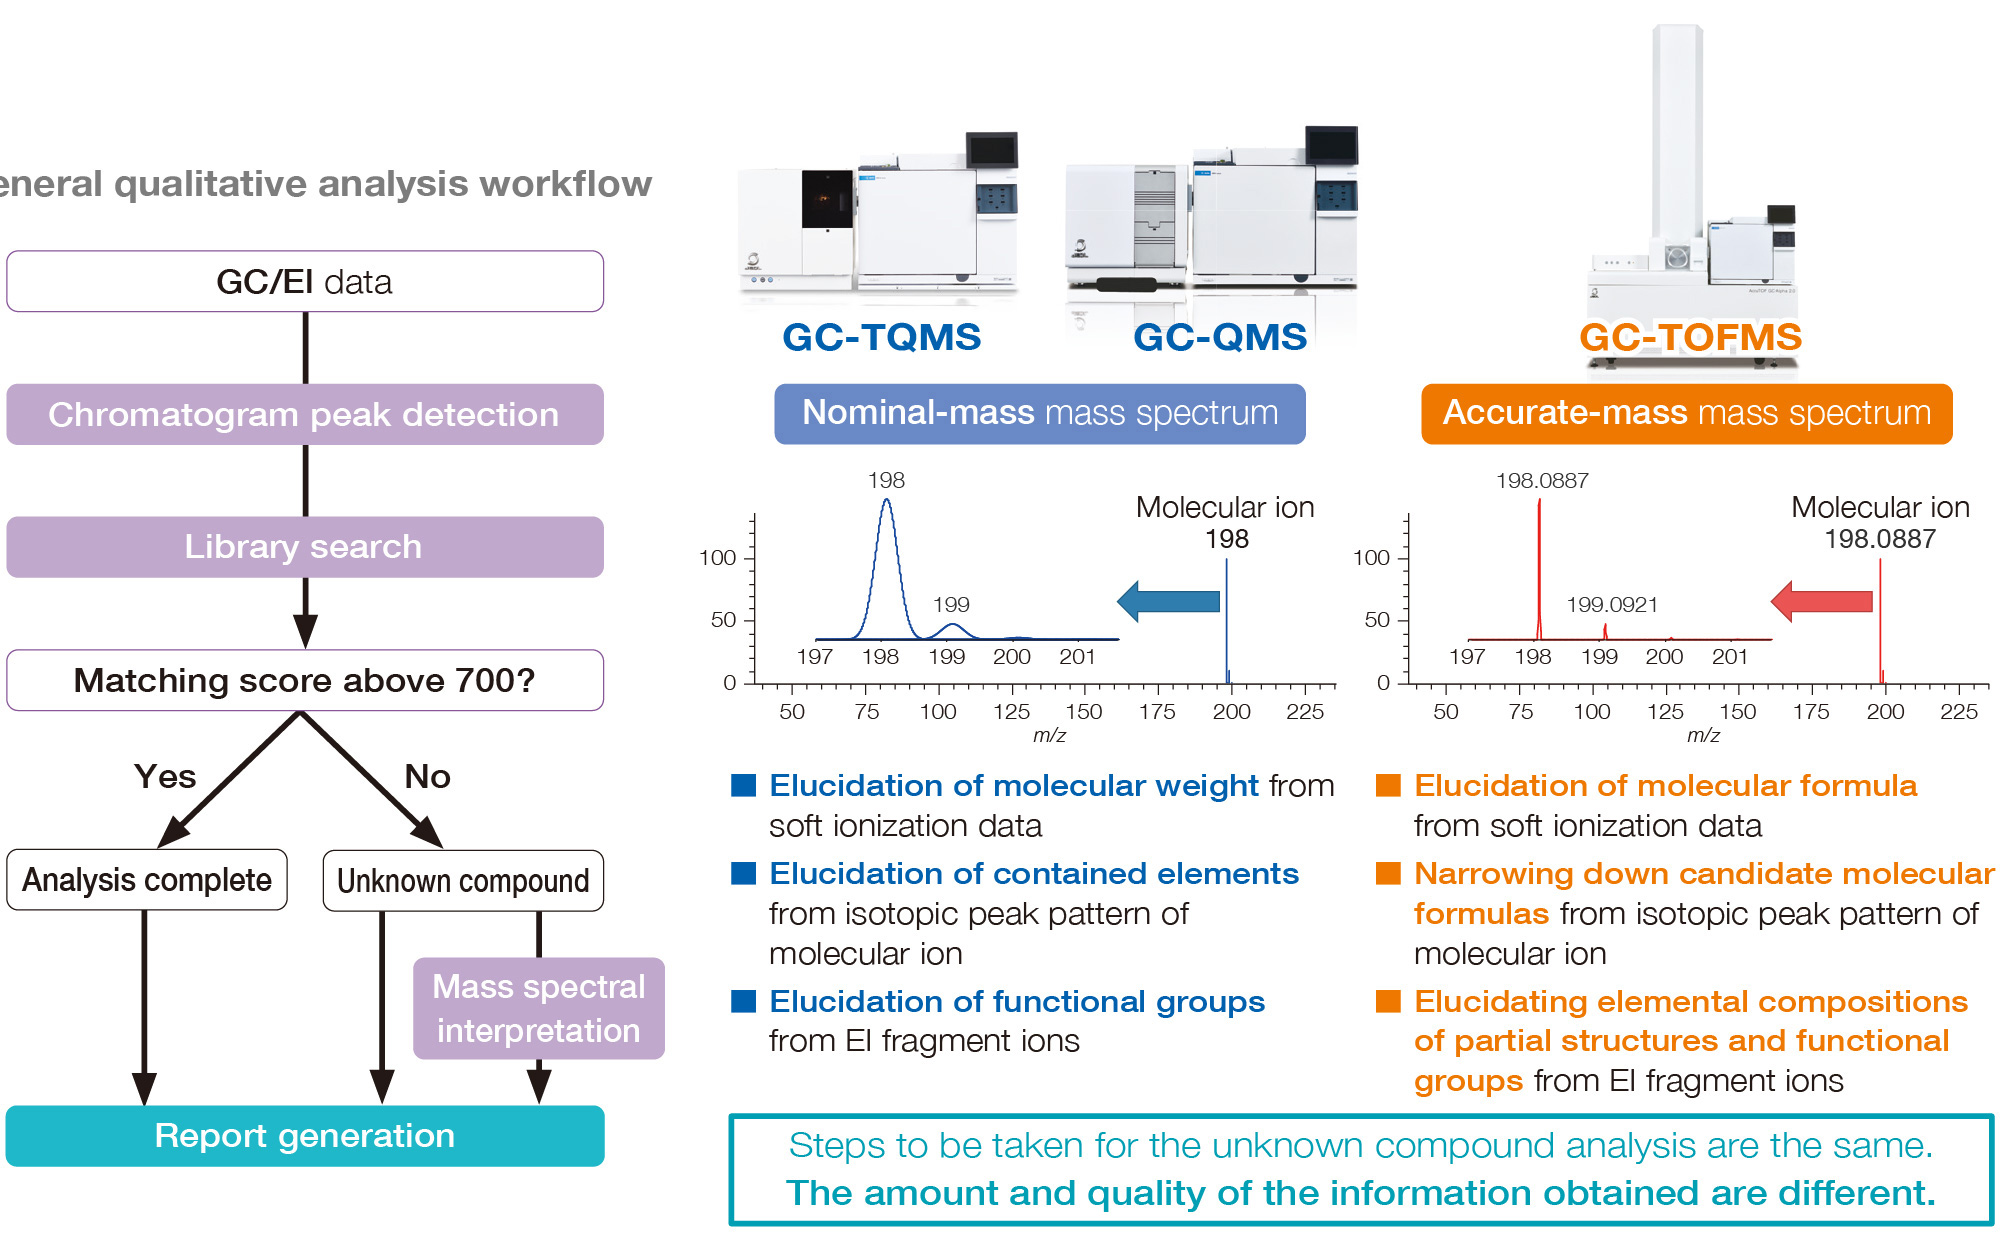
Qualitative Analysis Workflow
The qualitative analysis workflow for unknown components not registered in the library is shown below. It is difficult to analyze qualitatively unknown components by GC-QMS. In this case, the combination of the integrated qualitative analysis mentioned above and accurate mass analysis by GC-TOFMS is effective.
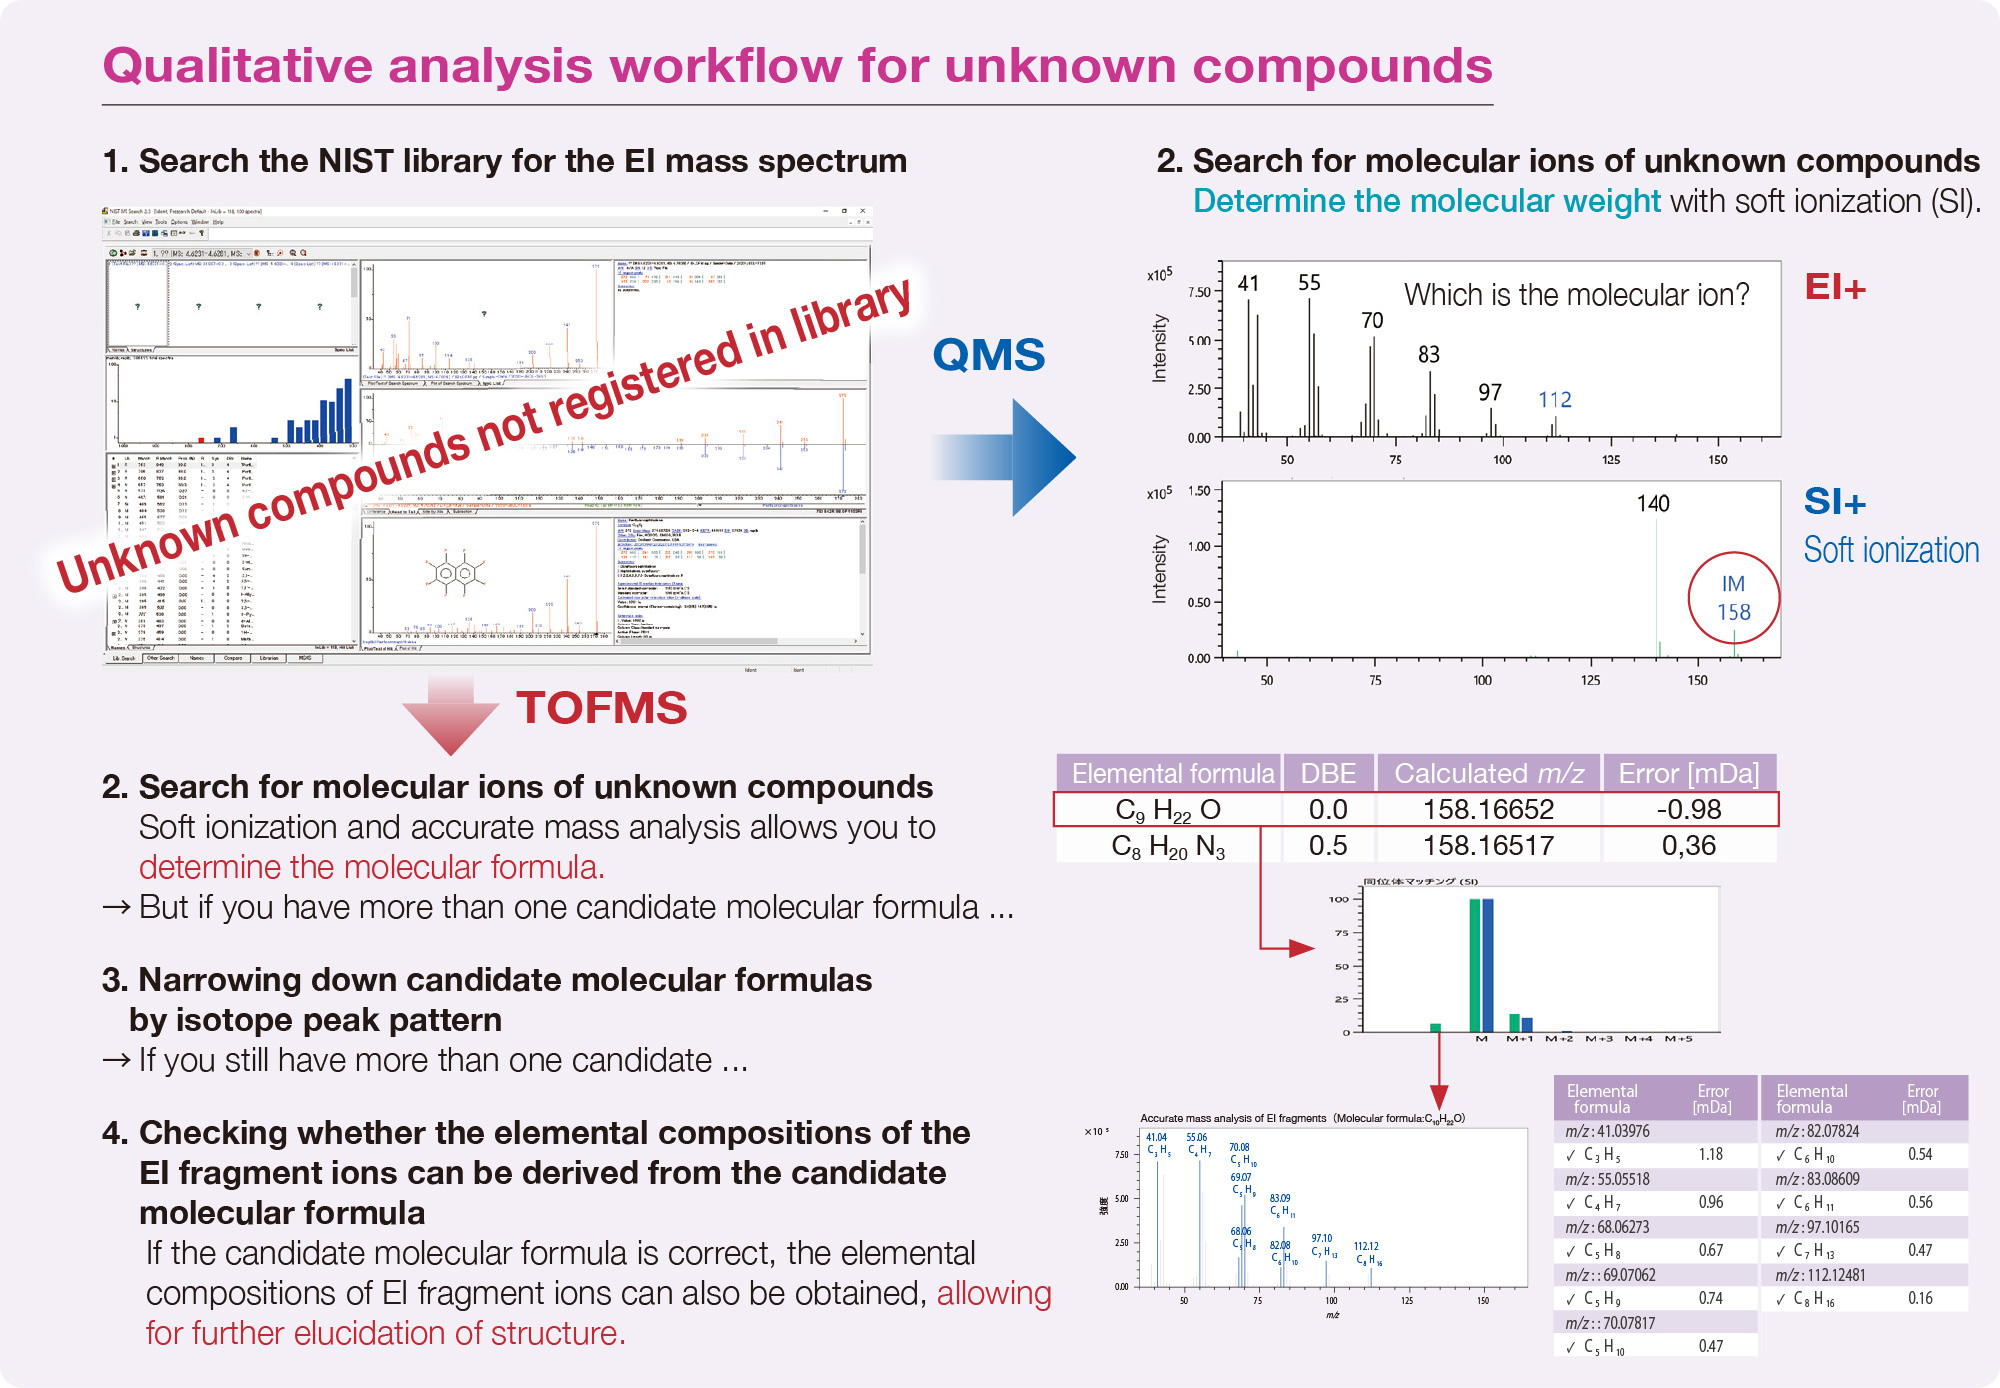
Note: Integrated analysis software - msFineAnalysis AI for JEOL GC-TOFMS and msFineAnalysis iQ for JEOL GC-QMS/TQMS - performs the qualitative analysis workflow above automatically.
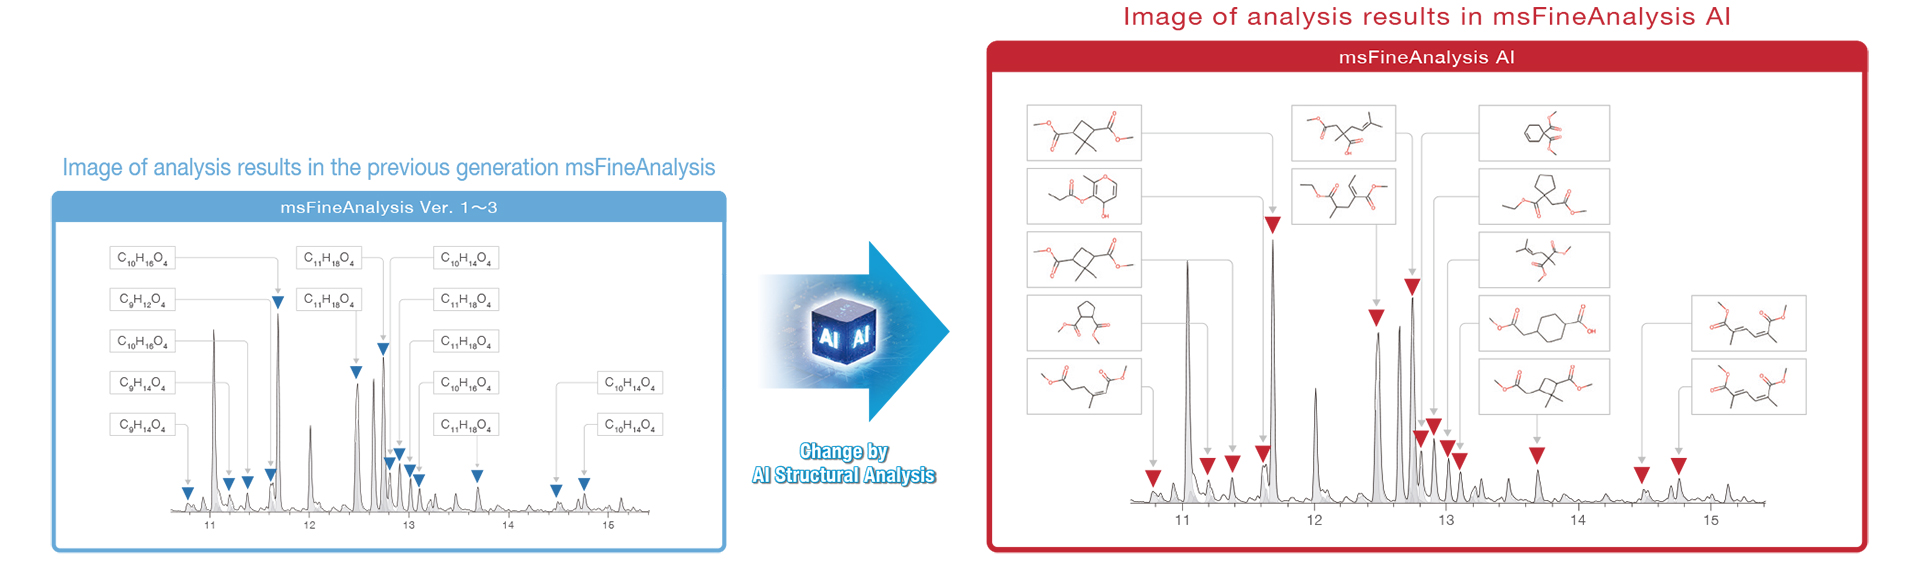
Structural formula prediction for unknown compounds
Obtaining a structural formula for unknown compound analysis is the primary goal of qualitative analysis. Because the large number of fragment ions observed in EI mass spectra contains a wealth of structural information, their compositional formulas can be used for accurate structural analysis. In general, high-mass fragment ions suggest functional groups and substructures, while low-mass fragment ions are suitable for compound classification. There are also fragmentations, such as the McLafferty rearrangement, that characterize the structure of a compound.
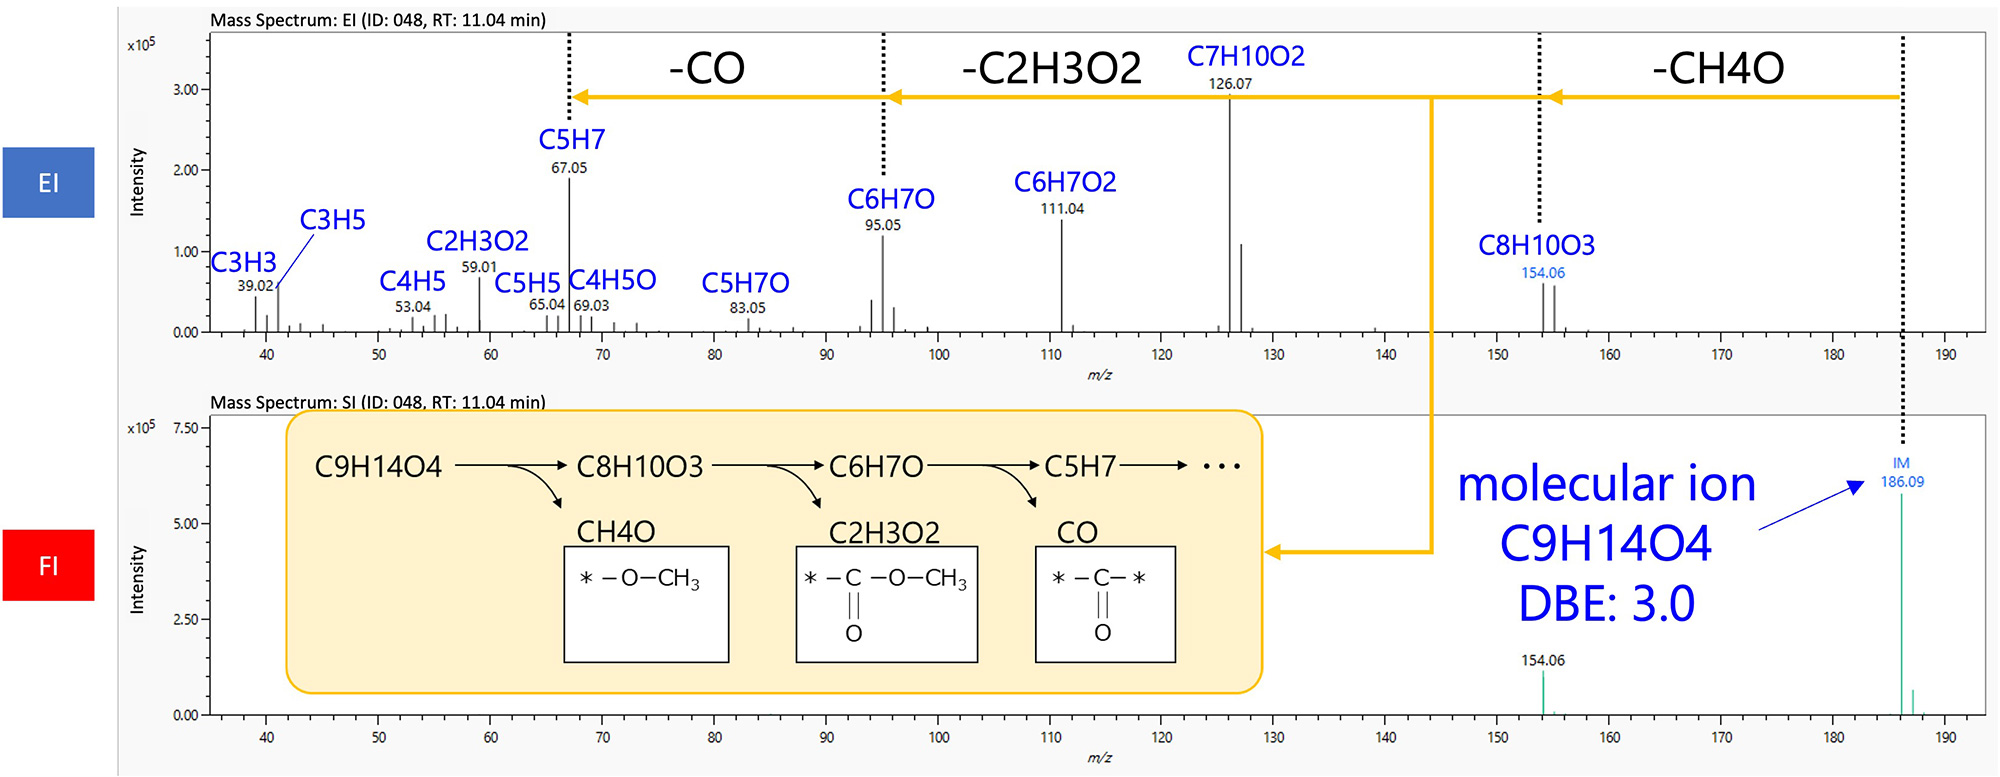
As mentioned above, molecular formulas and fragment ion elemental compositions are useful information in unknown compounds analysis. However, manual structural analysis requires knowledge and experience in interpreting mass spectra. In this case, analysis using automated structural analysis software is effective.
GC-MS Quantitative Analysis
Quantitative analysis is an analytical method for investigating the concentration of a target component contained in a sample, and is made possible by creating EICs of the ions derived from the target components of data measured by QMS/TQMS scan modes and by TOFMS. If the sensitivity is insufficient in scan mode, the measurement is performed in the SIM mode with QMS/TQMS. If the sensitivity and selectivity are insufficient even in SIM mode, it is necessary to perform measurements in SRM mode (described later) of TQMS.
Quantitative analysis from scan mode data and TOFMS data
EICs are created by specifying the m/z of ions with strong
intensity and
specific to the components to be analyzed.
Then, the quantitative value can be calculated
from the area of the peaks on the EICs.
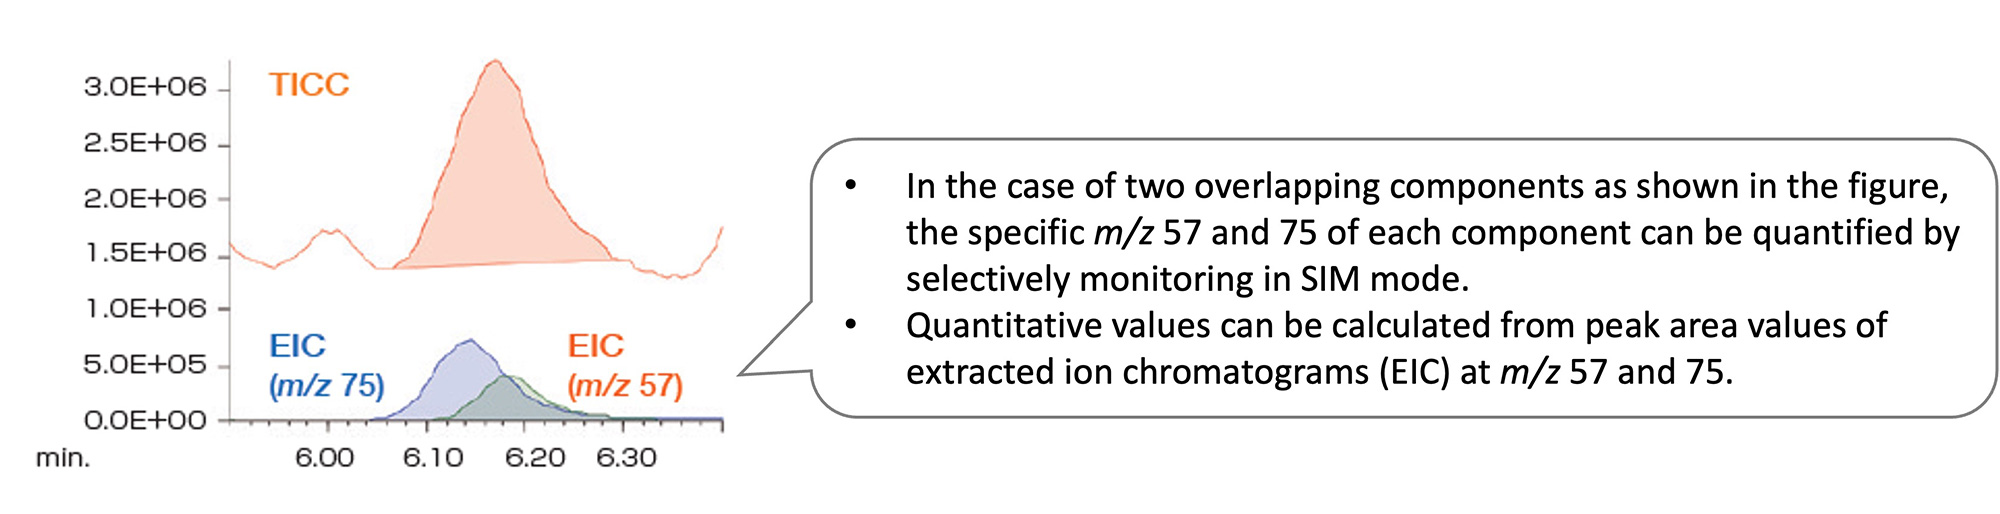
Quantitative analysis by SIM (Selected Ion Monitoring)
If the sensitivity is insufficient in scan mode, measurement can be performed in SIM mode. Ions with strong intensity and specific to the component to be analyzed are identified by measuring the standard sample in advance in scan mode. Then, a measurement is performed for the samples for the calibration curve and the actual samples under the SIM measurement conditions that monitor only these ions.
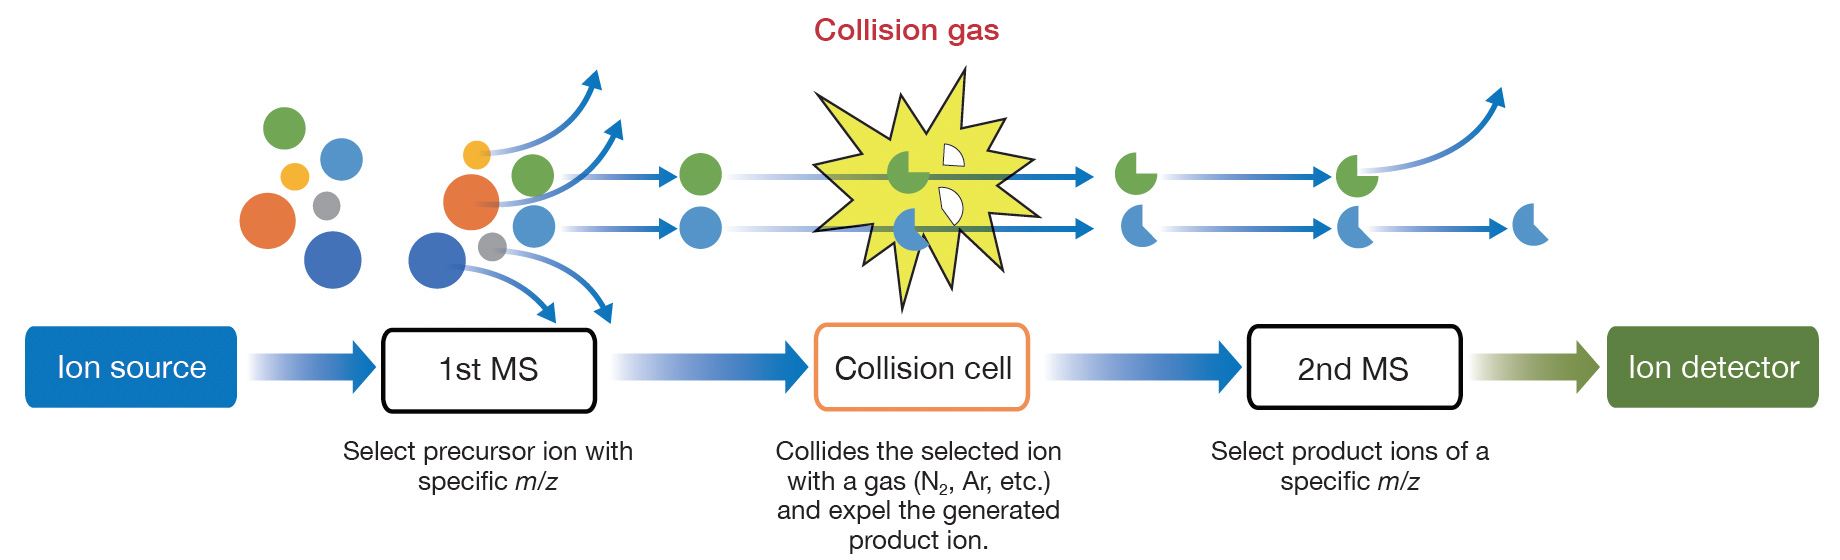
Quantitative analysis by SRM (Selected Reaction Monitoring)
SRM is a measurement mode specific to TQMS. It is highly selective and
is
effective for multi-component analysis where complete component separation by GC is not
possible, and for sample analysis where it is difficult to ensure the reliability of
quantitative results due to a large number of matrices.
A TQMS (Triple Quadrupole Mass Spectrometer) is a tandem mass spectrometer consisting of two
quadrupole mass analyzers, the 1st MS and the 2nd MS. Specific precursor ions selected in
the
1st MS are made to collide with the collision gas, and the specific product ions generated
are
selected in the 2nd MS and monitored. Since the mass separation of specific ions is
performed
twice in this way, more selective and reliable quantification results can be obtained than
in
the SIM mode in which mass separation is performed only once with the 1st MS.
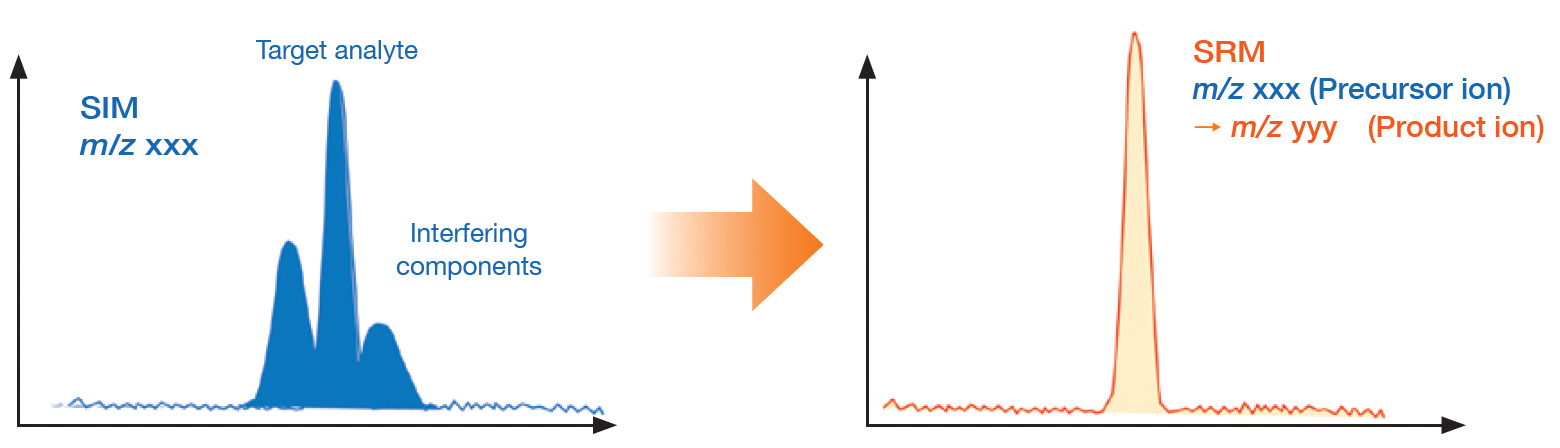
SRM enables highly sensitive and reliable quantitative analysis even for samples containing a large number of matrices, where the m/z of both the target and the interfering components overlap and cannot be accurately quantified using the SIM mode.
Sample preparation devices compatible with GC-MS
GC-MS can analyze components in gas, liquid, and solid samples - in combination with various sample preparation devices. Here, we introduce popular sample preparation devices, Head Space Sampler (HS), Pyrolyzer (Py), and the thermogravimetry/differential thermal analysis (TG/DTA) system.
Headspace sampler (HS)
A sample (liquid or solid) is placed in a sealed vial and heated. Volatile components in a sample are extracted and distributed between the gas phase and the sample. Then, a portion of the gas phase containing volatile components is introduced into a GC-MS.
Pyrolyzer (Py)
Py/GC/MS is a method used to analyze evolved gases or pyrolysis products generated by heating a sample in a pyrolyzer furnace. It is mainly used for the analysis of polymeric materials, including the identification of polymers and quantification of additives in resin.
Thermogravimetry / Differential Thermal Analysis (TG/DTA)
The TG/DTA system can be used to observe weight changes during the sample heating process and thermophysical properties such as heat generation and heat absorption by chemical reactions. In addition, by connecting to MS, gas components generated during the heating process can be analyzed.
- TG (Thermogravimetry)
A method to measure the weight change of a sample by heating. - DTA (Differential Thermal Analysis)
A method used to detect the temperature difference between a sample and a reference substance, and observe the exothermic/endothermic reaction in the sample.
| HS | Py | TG/DTA | |
|---|---|---|---|
| Maximum heating temperature | 250°C | 1,000°C | 1,600°C *varies depending on the model. |
| Maximum sample volume | Approx. 20 g (Container volume: up to ~20 mL) |
Several tens of milligrams (Container volume: up to ~80 μL) |
Approx. 1 g (Container volume: up to ~400 μL) |
| Usage and analysis target | Volatile components in a solid or liquid sample | Identification and structural analysis of polymers Qualitative and quantitative analysis of additives in polymeric materials |
Volatile components that evolve in sync with weight change |
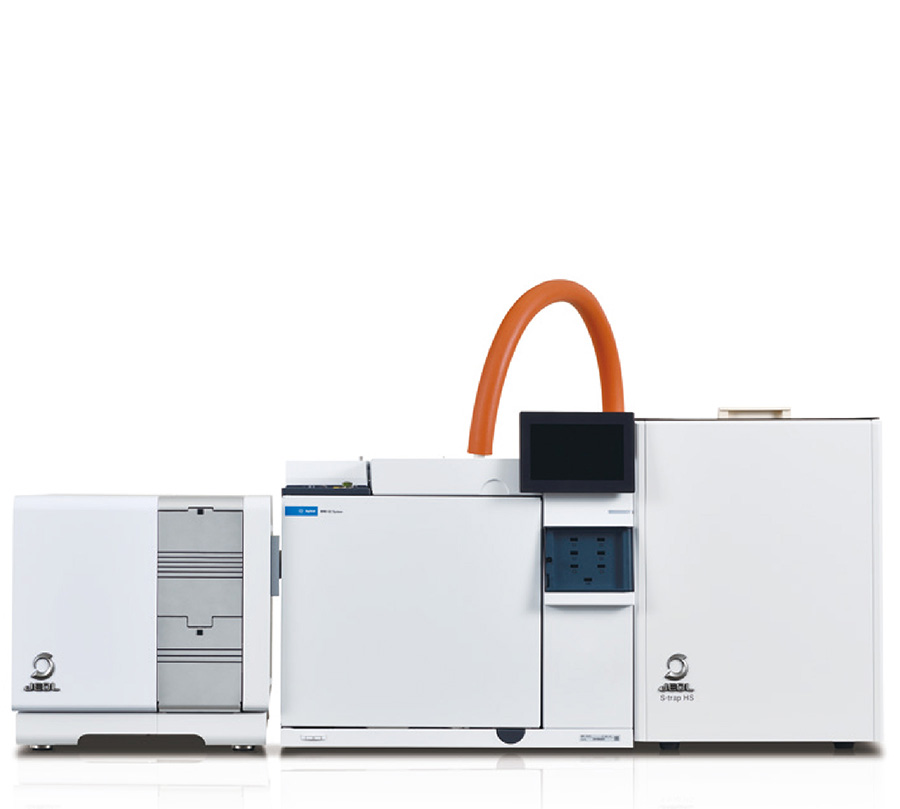
JMS-T1600GC UltraQuad™ SQ-Zeta and MS-62071 STRAP heads pace autosampler
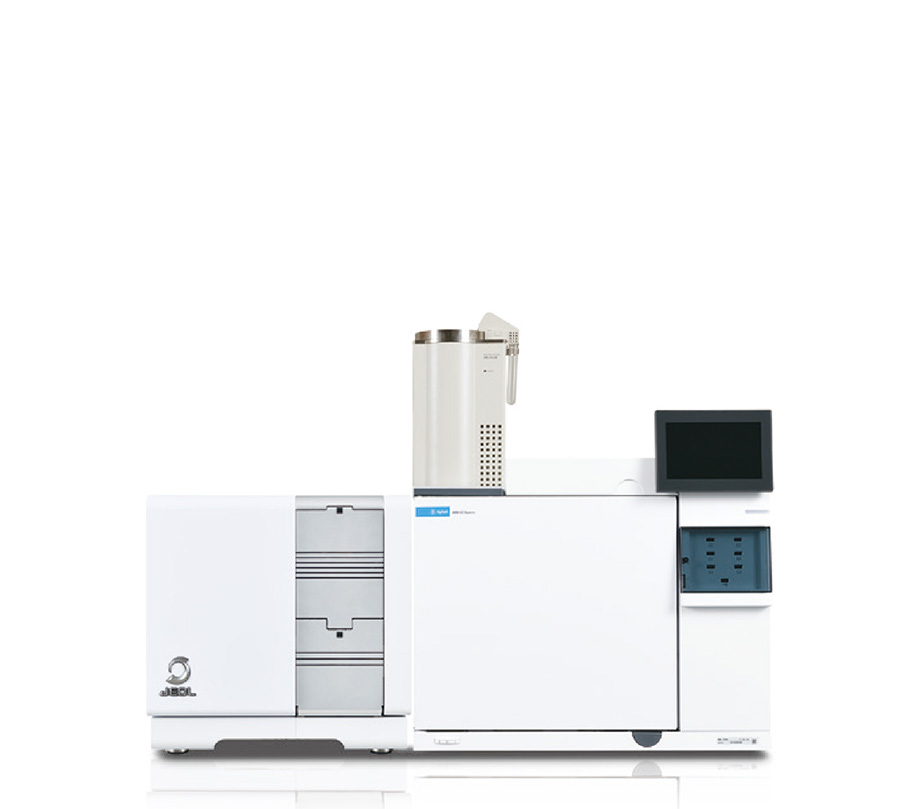
JMS-T1600GC UltraQuad™ SQ-Zeta and EGA/PY-3030D multishot pyrolyzer (Frontier Lab)
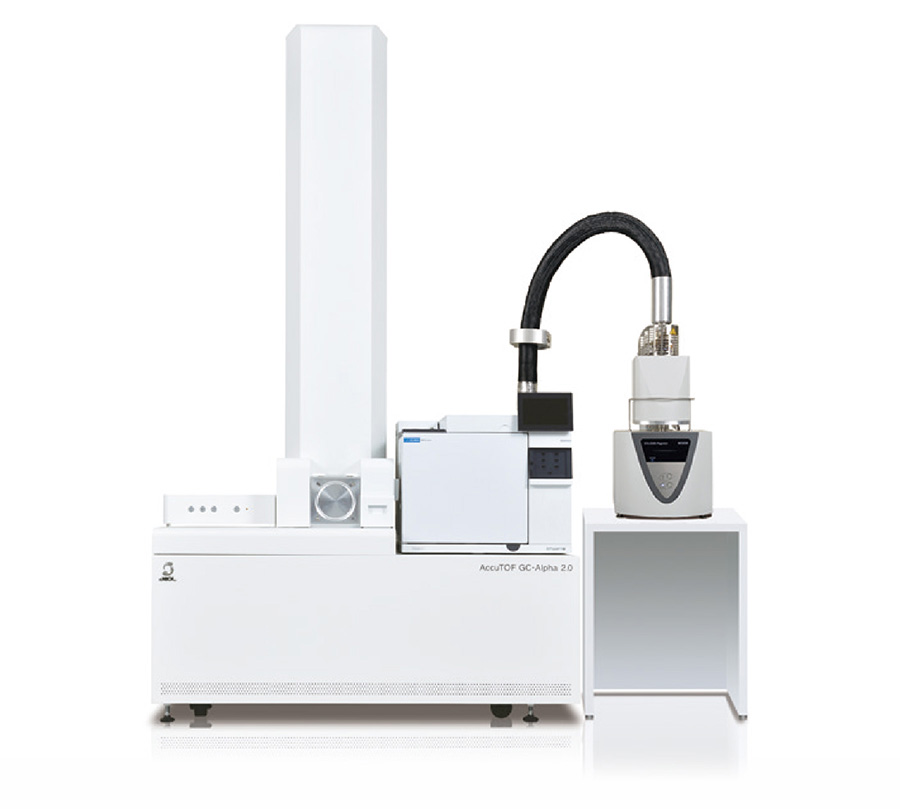
JMS-T2000GC AccuTOF™ GC-Alpha 2.0 and STA 2500 TG/DTA (Netzsch)