Structure solution of nano-crystalline powder: A YOKOGUSHI approach of SynergyED, HRMS, NMR, and computation

In this paper, we present a new method for determining the structure of nano-crystalline samples without relying on any prior structural and chemical information. Three-dimensional electron diffraction (3D ED) reveals the core atomic framework and the number of non-hydrogen atoms. High-resolution mass spectrometry (HRMS) is then used to determine the molecular formula. The positions of hydrogen atoms are estimated through geometry optimization based on quantum chemical calculations. Finally, solid-state NMR is used to confirm and, if necessary, refine the hydrogen positions.

Author
Yusuke Nishiyama(JEOL Ltd.)
He specializes in structural analysis using solid-state NMR. His research achievements have been highly recognized internationally, and he has been selected as one of the "Top 2% Scientists" in the world for eight consecutive years (as of 2025).
1. Introduction
Suppose we obtain a crystalline powder sample whose structure is completely unknown. How can we determine its crystal structure? When crystals are sufficiently large, single-crystal X-ray diffraction (SCXRD) is the gold standard for structure determination. However, SCXRD is not applicable to crystals smaller than approximately 1 µm. To address this limitation, three-dimensional electron diffraction (3D ED) has emerged as a powerful alternative for structure analysis of nano- and micro-crystals. 1, 2, 3 While 3D ED can successfully reveal the overall atomic framework, it often has difficulty distinguishing between elements with similar atomic numbers such as carbon, nitrogen, oxygen, and fluorine. 4 In addition, hydrogen atoms are poorly resolved or entirely invisible. These limitations make it challenging to determine the complete structure of a totally unknown sample using 3D ED alone.
In this article, we propose an integrated method for solving crystal structures without any prior information about the sample. The method combines SynergyED (3D ED), DART high-resolution mass spectrometry (DART-HRMS), solid-state NMR, quantum chemical calculations, and database mining, following the "YOKOGUSHI" strategy promoted by JEOL.
The overall workflow is as follows:
- SynergyED (3D ED) provides the atomic framework of the crystal, but without hydrogen atoms and elemental assignments. (Figure 1a).
- DART-HRMS determines the molecular formula, including the number of each element in the molecule (Table 1).
- Database mining, based on the SynergyED framework and the molecular formula from DART-HRMS, enables identification of candidate structural formulas. Hydrogen atoms are initially placed using a riding model (Figures 1b, 1c, and 2).
- Geometry optimization is performed using dispersion-corrected density functional theory (DFT-D), and solid-state NMR chemical shifts are calculated using the GIPAW method.
- Experimental verification of the complete crystal structure, including hydrogen positions, is achieved by comparing calculated and experimental solid-state NMR chemical shifts based on the NMR crystallography approach (Figure 3).
This workflow enables reliable structure determination of completely unknown powder crystalline samples and is applicable to a wide range of small-molecule compounds. The method has been published in Communications Chemistry 5 and is freely available online. The project was jointly led by the University of Torino and JEOL Ltd. through an international collaboration.
https://doi.org/10.1038/s42004-026-01902-1
Chiara Sabena, Federica Bravetti, Natsuki Miyauchi, Miho Nakafukasako, Yoshitaka Aoyama, Katsuo Asakura,
Kiyotaka Konuma, Masahiro Hashimoto, Yusuke Nishiyama*, Michele R. Chierotti*, An integrated workflow for
the structure elucidation of nanocrystalline powders, Commun. Chem. 9 (2026) 97. DOI:
10.1038/s42004-026-01902-1
2. 3D electron diffraction
SCXRD determines crystal structures by collecting diffraction data from a single crystal at multiple orientations. However, this method requires crystals that are typically larger than 1 µm. When crystals are smaller than this limit, SCXRD often fails. 3D ED overcomes this limitation by using an electron beam instead of X-rays to record diffraction patterns. Because electrons interact with matter about 104-105 times more strongly than X-rays, 3D ED enables structure determination from very small single crystals, including nano-sized samples that are inaccessible to SCXRD. Despite this advantage, structures obtained from 3D ED often suffer from several important limitations. Hydrogen atoms are usually poorly observed or completely invisible. In addition, elemental assignments can be ambiguous for atoms with similar atomic weights. This is a particularly serious problem in organic molecules, where elements such as carbon, nitrogen, oxygen, and fluorine are difficult to distinguish.
Figure 1a shows an initial structure obtained from 3D ED. In published studies, we often see colorful structural models like those in Figures 1b and 1c, where each atom is clearly labeled and hydrogen positions are fully defined. In reality, however, the direct result of 3D ED is usually a monochrome structure such as Figure 1a. Although this model contains valuable information, it is not sufficient by itself to derive a chemically meaningful structure. In practice, researchers often rely on prior chemical knowledge--such as a known molecular structure--to assign elements and place hydrogen atoms, thereby converting a monochrome model into a complete structural representation. However, when the sample is completely unknown, such assumptions cannot be made. Even if the molecular formula or skeletal structure is known, ambiguity can still arise from conformational isomers or tautomeric forms, which complicate the interpretation of the crystal structure. We have previously shown that combining 3D ED with solid-state NMR and quantum chemical calculations enables reliable structure determination through the NMR crystallography approach. 4 Nevertheless, without knowledge of the structural formula, it remains difficult to identify the correct crystal structure with high confidence.
Even in this incomplete form, Figure 1a already contains several important pieces of information derived from 3D ED:
- The crystal contains two distinct molecules, labeled A and B.
- Molecules A and B consist of 12 and 10 non-hydrogen atoms, respectively (with no information on hydrogen atoms).
- Molecule A includes an aromatic ring, while molecule B contains a sulfur atom.
- Two molecules are present in the asymmetric unit (Z' = 2).
- The skeletal frameworks of the non-hydrogen atoms in molecules A and B are clearly defined.
Although this information is highly informative, it does not reveal the chemical identity of the molecules. To fully determine the structure, additional analytical techniques must be combined with 3D ED structures.
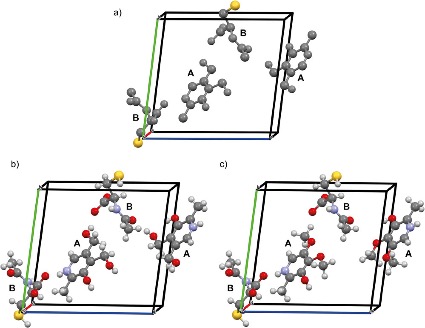
Figure 1 3D ED crystalline structure in an asymmetric unit cell. (a) pristine structure obtained from 3D ED. Two chemically different molecules (A and B) are included. B includes a sulfur atom. (b, c) Two final candidates obtained from screening using DART-HRMS and database mining. Figure reproduced from C. Sabena et al., Communications Chemistry (2026), DOI: 10.1038/s42004-026-01902-1, licensed under CC BY 4.0.
3. DART-HRMS
A powerful way to overcome the limitations of 3D ED is HRMS. HRMS measures the molecular weight of a compound with extremely high precision, typically expressed in daltons (Da). The dalton is defined based on carbon-12: by definition, the atomic weight of 12C is exactly 12 Da. In contrast, other atoms have atomic weights that are close to, but not exactly, the summation of protons and neutrons in the nucleus. For example, hydrogen (1H) has an atomic weight of 1.007825 Da, not exactly 1 Da, and nitrogen (14N) has an atomic weight of 14.003074 Da, not exactly 14 Da. Although atomic weights are often approximated as the sum of protons and neutrons, small differences always present. Because the molecular weight of a compound is the sum of the precise atomic weights of all its constituent atoms, accurate measurement of the molecular weight allows the molecular formula to be uniquely determined. In other words, HRMS provides the exact number of atoms of each element present in a molecule. Although this information alone does not reveal the full structural formula, it plays a critical role in narrowing down possible crystal structures and complements the skeletal information obtained from 3D ED.
In this study, we use direct analysis in real time (DART) 6 as the ionization method for HRMS. DART is a soft-ionization technique that produces minimal fragmentation, making it particularly suitable for small molecules. As a result, intact molecular ions can be observed, enabling precise determination of molecular weight and thus molecular formula. Another advantage of DART is its simplicity and speed: spectra can be obtained immediately by simply placing the sample in the DART-HRMS system. For the present sample, multiple peaks were observed in the DART-HRMS spectrum. All of these peaks can be consistently assigned to simple combinations of the two molecules identified by 3D ED, labeled A and B. The resulting molecular weights and molecular formulas are summarized in Table 1.
Importantly, the HRMS results are fully consistent with the information obtained from 3D ED. They confirm (1) the presence of two distinct molecules, A and B, (2) the number of non-hydrogen atoms in each molecule, and (3) the presence of a sulfur atom in molecule B. Together, HRMS and 3D ED provide complementary information that significantly constrains the possible crystal structures and enables further structural refinement.
Table1 Precise molecular weight and molecular formula derived from the molecular weight.
| Precise molecular weight | molecular formula | |
|---|---|---|
| A | 170.0815 Da (M+H)+ | C8H11NO3 |
| B | 162.0231 Da (M-H)- | C5H9NO3S |
4. Database mining
Molecular formula is very important information for structure elucidation, however, it is not enough to determine structure formula. Here we focus on database. There are various database of chemical structures. We can obtain a list of candidates by feeding molecular formula into a database. Here, we use PubChem which is open for everyone from NIH. 7 PubChem includes more than 100 million structures and allows us various option to search them. First we feed the molecular formulas determined by DART-HRMS, leading to 4921 candidates for A and 706 candidates for B. Assuming PubChem includes the correct structure in it, the final structures should be involved in these candidates. However, number of candidates are too large to determine molecular structure. As shown here, molecular formula is not sufficient to determine structure even for small molecules.
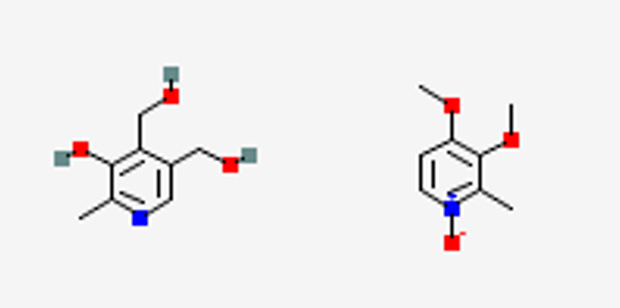
Fortunately, we already know the skeleton structure via 3D ED, which we can feed into database to narrow down the number of candidates. Especially, number of non-hydrogen atoms (point 2) and partial structure (point 5) play a crucial role. First, molecule A includes a specific aromatic ring. By considering the molecular formula of A(C8H11NO3), this ring should be either benzene ring (C6) or pyridine ring (C5N). These information can be incorporate into PubChem query together with the number of non-hydrogen atoms of 12. PubChem returns 18 (5) structures for a molecular weight of 169.0739 Da and C6(C5N) ring, in total 23 structures. Here we use molecular weight rather than molecular formula due to limitation of PubChem search function (July 2025) and it is not a fundamental limitation of the current method. We believe it will be improved to accept molecular formula in near future. Instead, we may use other chargeable database for structure solution. By visual inspection of these 23 candidates, we found only two structures which match with 3D ED skeleton structures as shown in Figure 2A. As demonstrated here, we have efficiently narrowed the searching space from 4921 to 2 by using database mining together with 3D ED skeleton structure and DART-HRMS.
(A)
(B)
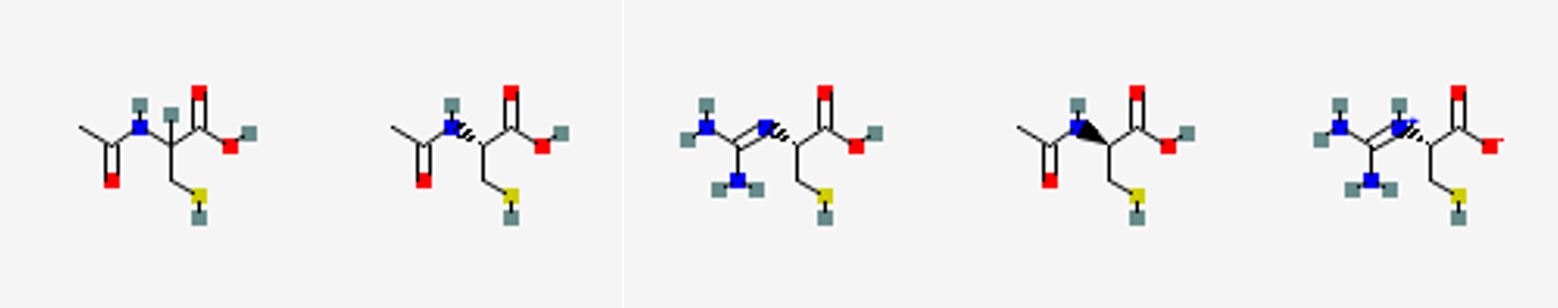
Figure 2 Candidates of chemical structures of molecule A and B. Pubchem search was conducted with the molecular weight, number of non-hydrogen atoms, and partial structures. The structural search was followed by visual comparison to the 3D ED skeleton structure (Figure 1a). Figure reproduced from C. Sabena et al., Communications Chemistry (2026), DOI: 10.1038/s42004-026-01902-1, licensed under CC BY 4.0.
The same database-mining approach can be applied to molecule B. Starting from the 706 candidate structures obtained using molecular formula alone, we further refine the search using information from the 3D ED skeleton structure. Specifically, we include the presence of a sulfur-containing partial structure (C-S, N-S, or O-S), a molecular weight of 163.0303 Da, and a total of 10 non-hydrogen atoms. With these constraints, PubChem returns 128 candidate structures. Applying an additional screening step based on detailed comparison with the 3D ED skeleton structure eliminates most of these candidates and leaves only five plausible structures, as shown in Figure 2B. Among these five candidates, three are consistent with the molecular formula determined by DART-HRMS. This final screening step is necessary because the molecular weight information recorded in PubChem has limited precision. As a result, structures with slightly different molecular formulas may still appear in the candidate list. This is a database-related limitation rather than a fundamental issue with the proposed workflow. If direct searches by molecular formula were available, this step could be avoided.
The three remaining candidates differ only in their absolute configuration and therefore represent the same chemical compound: N-acetyl-cysteine. In the present study, the kinetic refinement approach used in 3D ED does not determine absolute structure, whereas a dynamical diffraction analysis would be required for that purpose. Here, we assign the compound as N-acetyl-L-cysteine, based on its natural abundance and prevalence in biological systems.
By incorporating this information into the original 3D ED skeleton structure shown in Figure 1a, we obtain the final crystal structure with complete elemental assignments, as shown in Figures 1b and 1c.
5. Solution NMR
In many cases, database mining combined with 3D ED and HRMS allows us to narrow down the crystal structure to a single candidate. For example, in the case of molecule B, only one chemical structure remained after database screening. However, this is not always the case. As demonstrated for molecule A, multiple plausible structures may still remain even after extensive database mining. For molecule A, two structural candidates were identified that differ only in a small but important partial structure: one contains a hydroxymethylene group (-CH2-OH), while the other contains a methoxy group (-O-CH3). Distinguishing between these two possibilities is difficult using diffraction data alone, but it can be done easily using solution NMR. In particular, the 13C DEPT-135 experiment provides a clear and simple way to differentiate these groups. In a DEPT-135 spectrum, CH carbons appear as negative signals, whereas CH3 carbons give positive signals. The observed DEPT-135 spectrum for molecule A shows a negative signal, indicating the presence of a -CH2-OH group rather than a -O-CH3 group. Based on this result, we can unambiguously assign the structure of molecule A as N-pyridoxine, as shown in Figure 1b. This example highlights how solution NMR provides complementary and decisive information when multiple structural candidates remain after database mining.
6. Quantum Computation
As shown above, we successfully identify the molecular identities and overall crystal structure of the sample. However, the positions of hydrogen atoms remain ambiguous. This is because hydrogen atoms scatter electrons very weakly and are therefore poorly resolved or completely invisible in 3D ED maps. To determine the hydrogen positions reliably and further refine the crystal structure, we perform geometry optimization using dispersion-corrected density functional theory (DFT-D). During this optimization, hydrogen atoms are placed at energetically reasonable positions based on chemical bonding and intermolecular interactions, leading to a physically consistent and stable crystal structure. In addition to structural refinement, the optimized structure allows us to calculate solid-state NMR chemical shifts using the gauge-including projector augmented-wave (GIPAW) method. These calculated chemical shifts provide a direct link between the theoretical structure and experimental NMR observations.
This combined approach is essential for two reasons. First, it enables accurate determination of hydrogen positions, which cannot be obtained from diffraction data alone. Second, it provides an independent means to validate the final crystal structure by comparing calculated and experimental solid-state NMR chemical shifts. Together, DFT-D geometry optimization and GIPAW-based NMR calculations play a critical role in defining and confirming the complete crystal structure, including hydrogen atoms.
7. Solid State NMR
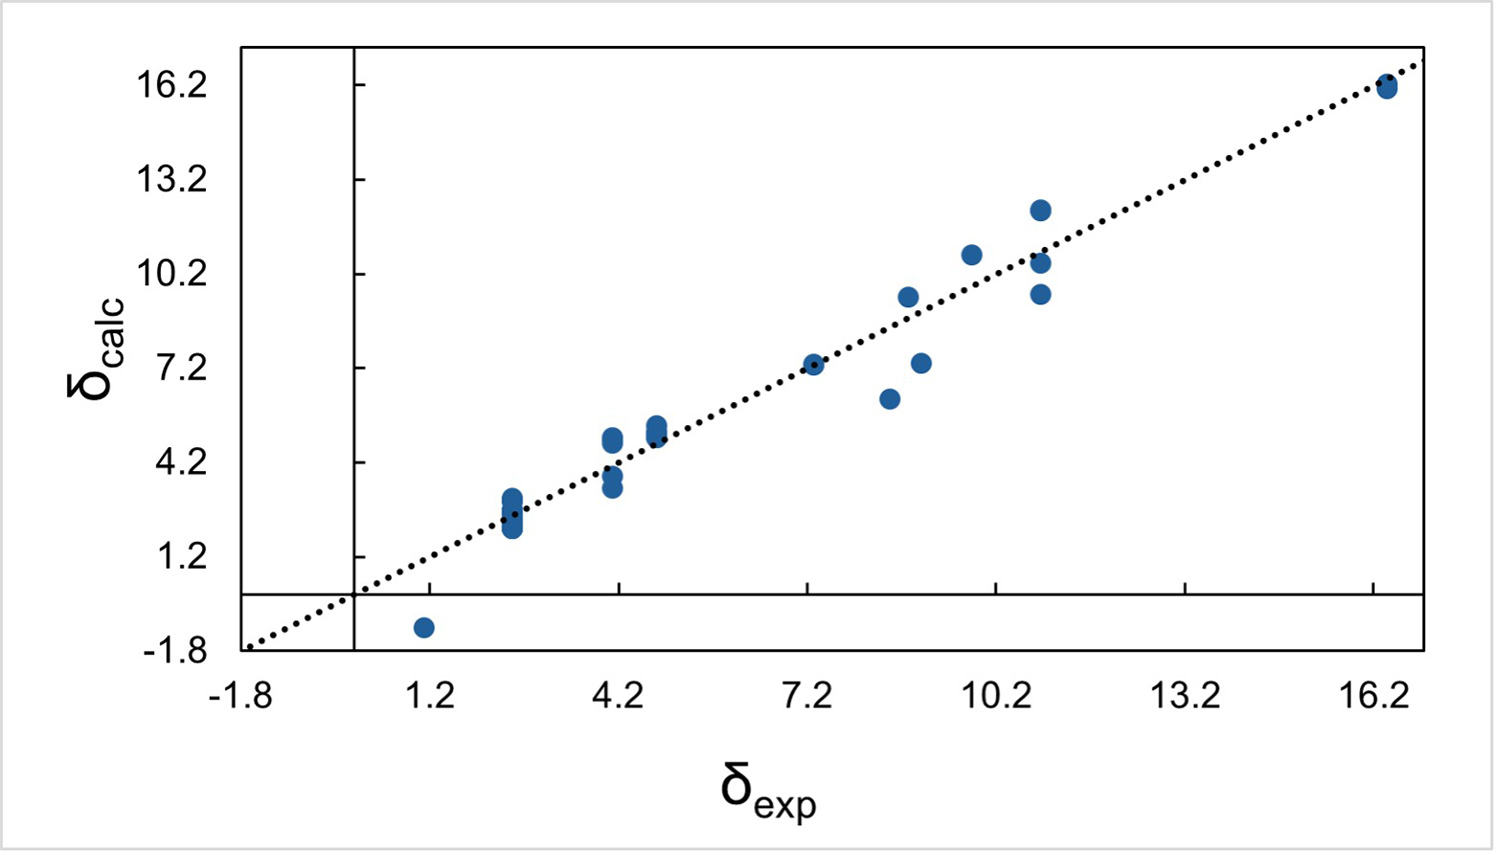
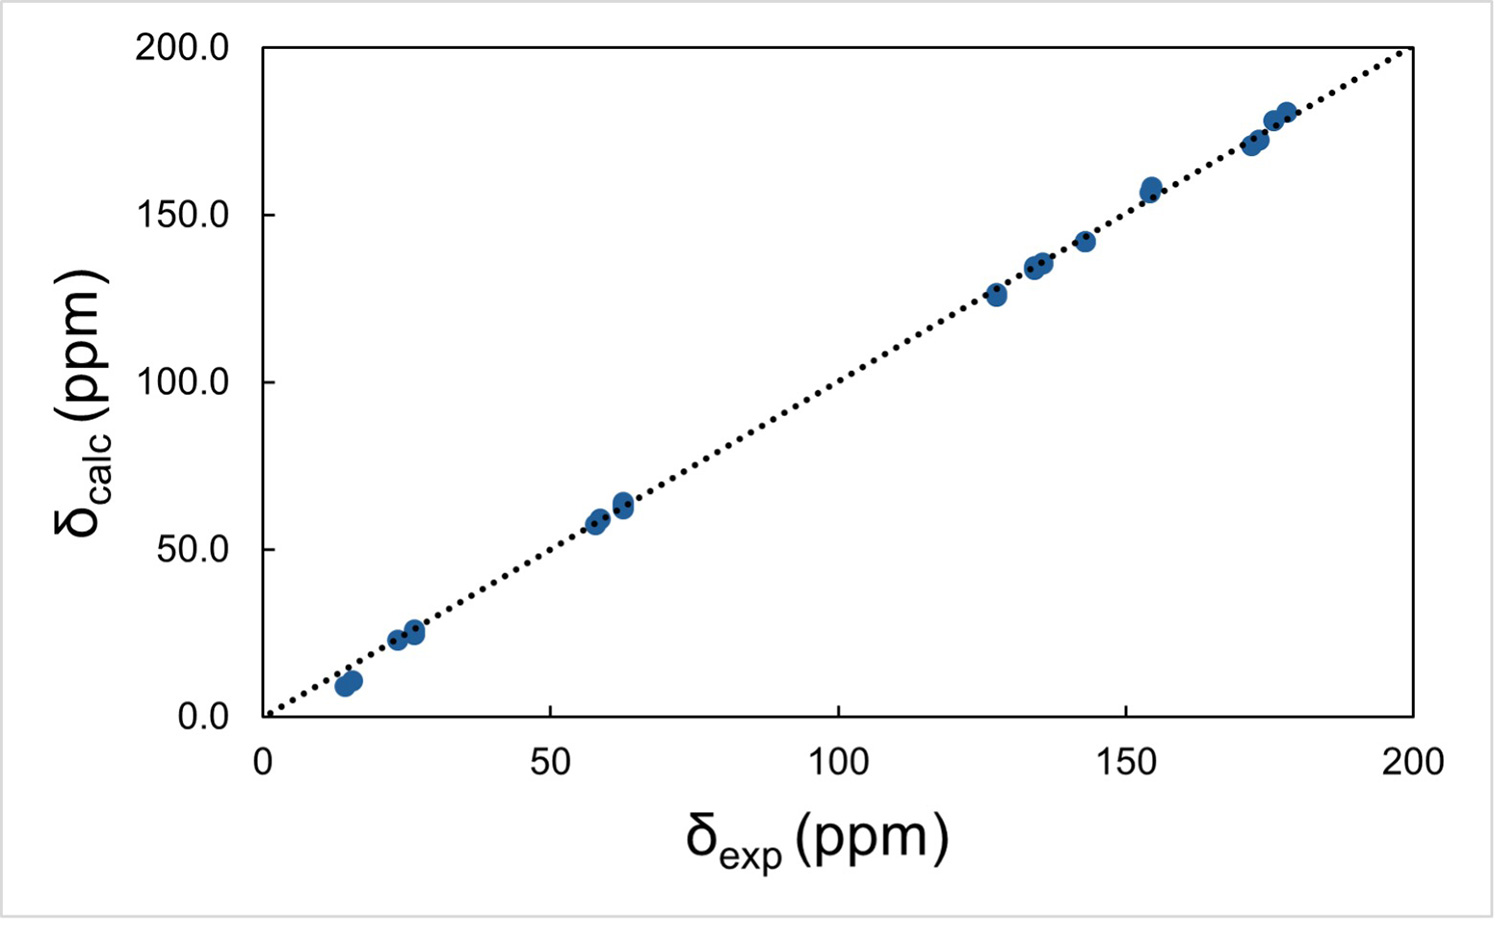
At this stage, we have obtained a complete crystal structure with well-defined hydrogen positions by integrating 3D ED, HRMS, database mining, and quantum chemical calculations. However, it is important to note that the final structure, including hydrogen positions, is derived from computational optimization and has not yet been experimentally confirmed. To experimentally validate the proposed structure, we apply an NMR crystallography approach. 8 In this method, the correctness of a crystal structure is evaluated by comparing experimental solid-state NMR chemical shifts with those calculated from the optimized crystal structure. Because NMR chemical shifts are highly sensitive to local atomic environments, including molecular conformation and intermolecular packing, good agreement between experimental and calculated values provides strong evidence that the structure is correct. In practice, the quality of agreement is typically evaluated using the root-mean-square deviation (RMSD) of the chemical shifts, most commonly for 1H and 13C nuclei. For a correctly determined structure, the RMSD values are usually less than 0.5 ppm for 1H and less than 3 ppm for 13C. Figure 3 shows the comparison between experimental and calculated chemical shifts for 1H, 13C, and 15N in the present study. The final structure shown in Figure 1b yields RMSD values of 0.5 ppm for 1H and 2.3 ppm for 13C, meeting these criteria and thereby validating the proposed structure.
Beyond confirming atomic positions, this agreement addresses a fundamental question that always arises in 3D ED studies:
'Does the structure determined by 3D ED truly represent the entire sample?'
Because 3D ED analysis is performed on one or a small number of individual crystals selected from a large number of crystals, there is always a risk that the observed structure corresponds to a minor phase or even to a contaminant. In contrast, solid-state NMR measures signals from the entire bulk sample. Therefore, the good agreement between experimental and calculated NMR chemical shifts shown in Figure 3 demonstrates that the validated structure is representative of the whole sample, not just a selected microcrystal. In this way, NMR crystallography plays a crucial role in both experimental validation of hydrogen positions and confirmation of sample representativeness, completing the structure determination workflow.
(a)
(b)
(c)
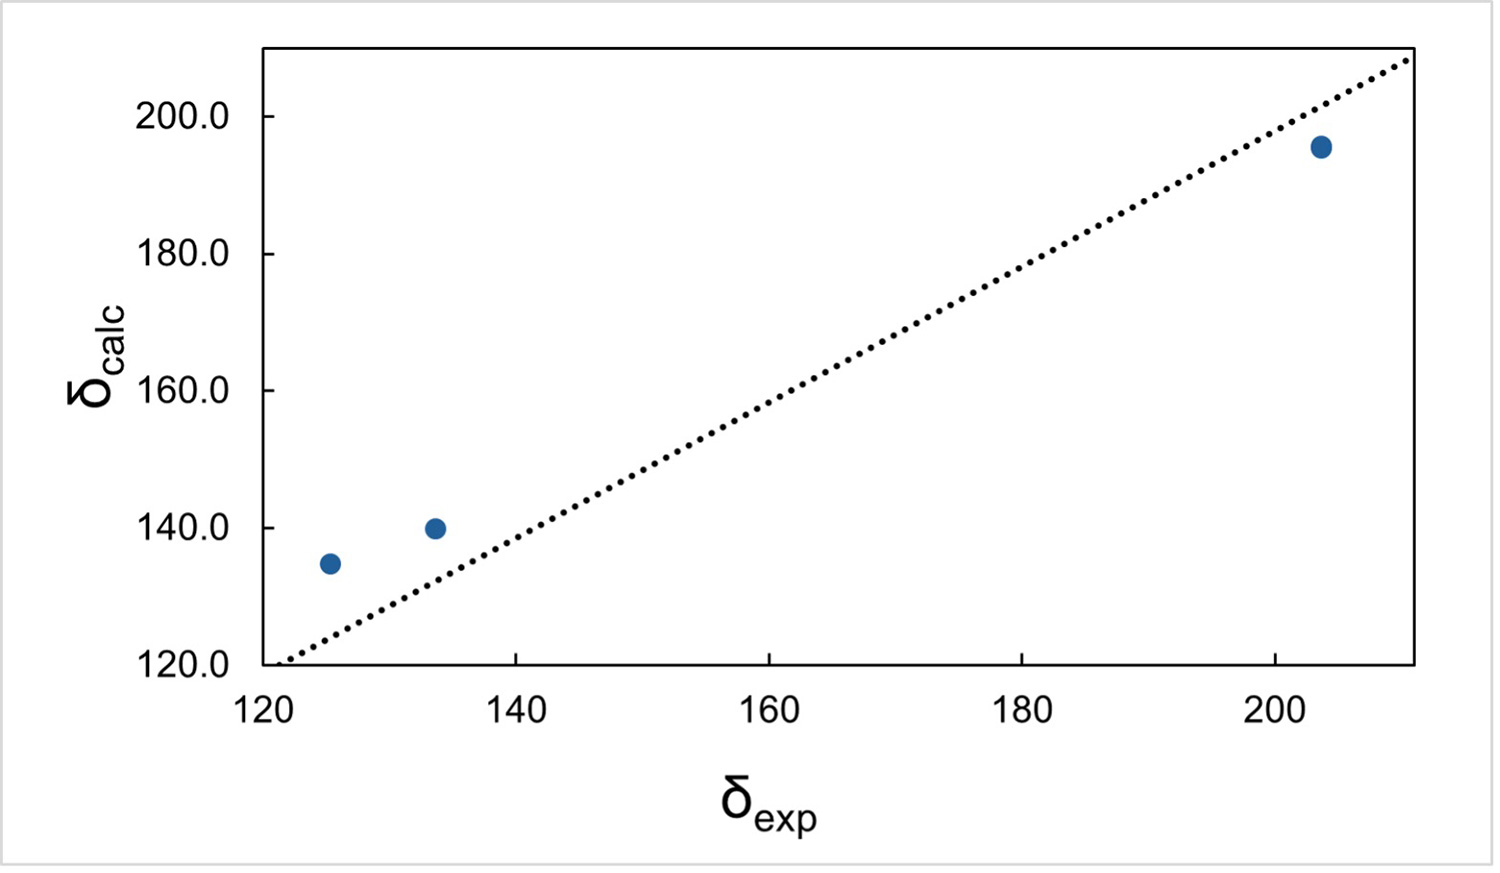
Figure 3 Calculated and experimental NMR chemicals shifts of (a) 1H, (b) 13C, and (c) 15N. Figure reproduced from C. Sabena et al., Communications Chemistry (2026), DOI: 10.1038/s42004-026-01902-1, licensed under CC BY 4.0.
In some cases, a very careful analysis of hydrogen positions is essential. One important example is the discrimination between salts and cocrystals, which is a critical issue in pharmaceutical science. 9, 10 The solid form of an active pharmaceutical ingredient can strongly influence its stability, solubility, and bioavailability, making accurate identification of proton positions highly important. In the present example, the crystal structure reveals a strong intermolecular interaction between the nitrogen atom of the pyridine ring in pyridoxine and the carboxyl group of N-acetyl-L-cysteine, forming an O···H···N hydrogen-bonding motif. After geometry optimization using DFT-D, the proton originally associated with the carboxyl group is fully transferred to the pyridine nitrogen, indicating the formation of a molecular salt rather than a neutral cocrystal. However, hydrogen atoms involved in non-covalent interactions, especially those forming hydrogen bonds, often exhibit labile positions. 11 Their locations can depend on temperature and dynamic molecular motion. Because DFT-D geometry optimization was performed at 0 K, the optimized structure does not necessarily represent the proton position under ambient conditions.
To address this issue experimentally, we performed a quantitative distance measurement between 1H and 14N using the PM-S-RESPDOR solid-state NMR experiment at room temperature. 12 This technique allows rapid and direct determination of heteronuclear distances involving quadrupolar nuclei under realistic experimental conditions. The DFT-D optimized structure predicts a 1H-14N distance of 1.07 Å, whereas the experimental measurement yields a slightly longer distance of 1.16 Å (Figure 4). Despite this difference, which can be attributed to thermal motion and proton dynamics at ambient temperature, the experimental result clearly supports proton transfer and confirms salt formation. We therefore conclude that the multicomponent system of pyridoxine and N-acetyl-L-cysteine forms a molecular salt, specifically pyridoxine-N-acetyl-L-cysteine salt.
This example highlights the importance of combining quantum chemical calculations with advanced solid-state NMR experiments to accurately determine hydrogen positions and to distinguish between closely related solid forms such as salts and cocrystals.
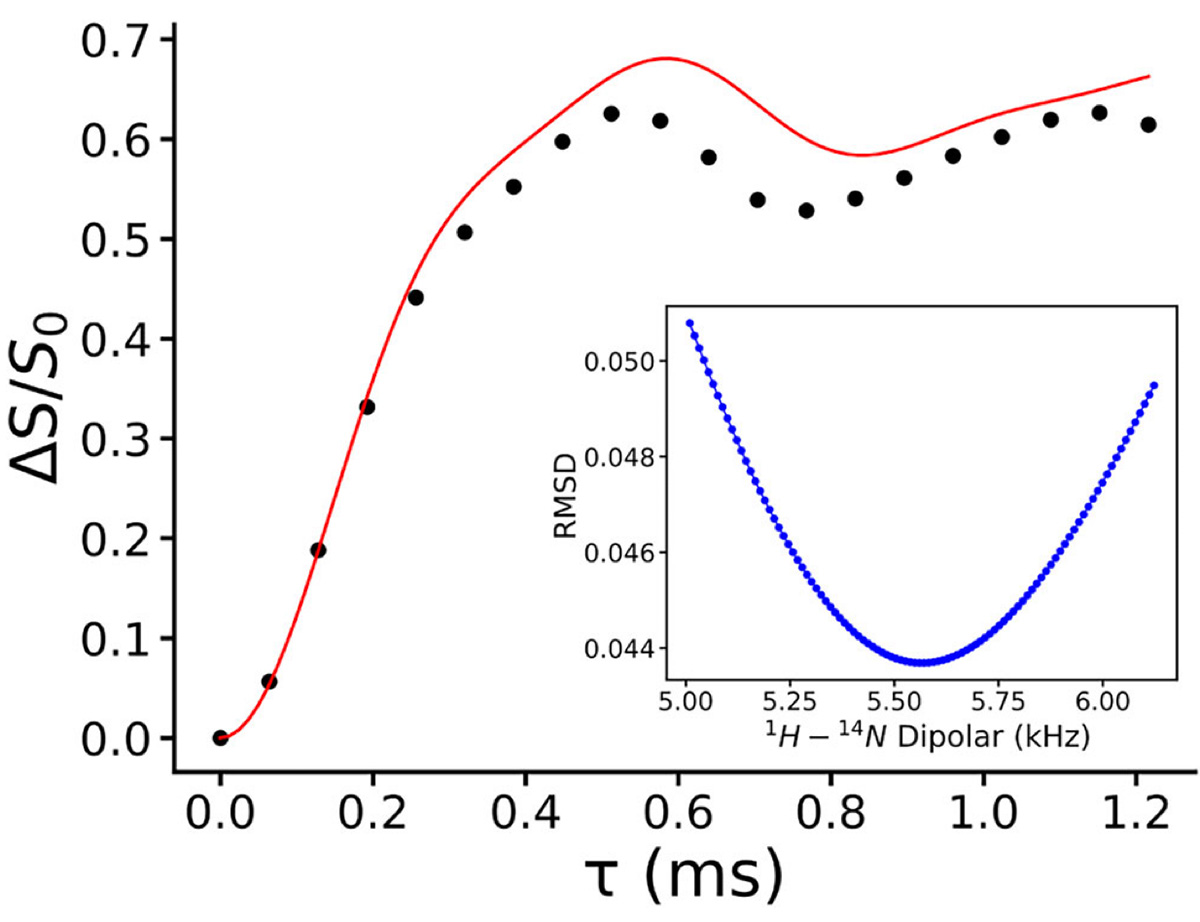
Figure 4 Experimental (dotted) and analytical (red curve) fraction curve of 1H-14N PM-S-RESPDOR of pyridoxine N-acetyl-L-cysteine salt. Figure reproduced from C. Sabena et al., Communications Chemistry (2026), DOI: 10.1038/s42004-026-01902-1, licensed under CC BY 4.0.
8. Second example
The example described above demonstrates the structure determination of a polycrystalline powder sample that was initially treated as completely unknown. In fact, this sample was synthesized intentionally by a mechanochemical reaction between pyridoxine and N-acetyl-L-cysteine. The system therefore serves as a well-controlled test case for validating the proposed methodology.
To further demonstrate the generality and robustness of this approach, we applied the same workflow to a different sample with no previously reported crystal structure. Using the integrated strategy based on 3D ED, HRMS, database mining, quantum chemical calculations, and NMR crystallography, we successfully solved and confirmed the crystal structure of N-formyl-methionyl-leucyl-phenylalanine. 5 To the best of our knowledge, the crystalline structure of this compound has not been reported previously. This second example demonstrates that the proposed method is not limited to a specific class of compounds, but is broadly applicable to diverse polycrystalline materials, including peptides with complex molecular architectures.
9. Conclusion
How can we determine the crystal structure of a completely unknown powder sample? In this work, we propose an integrated approach that combines SynergyED (3D ED), DART-HRMS, NMR spectroscopy, quantum chemical calculations, and database mining. By integrating these complementary techniques, crystal structures can be solved without any prior information about the sample. An important advantage of this approach is its accessibility. We make use of open-source software such as Quantum ESPRESSO 13, 14 and freely available chemical databases such as PubChem. As a result, the core workflow does not require expensive tools. To streamline the procedure, we employ JEOL JASON software to handle outputs from Quantum ESPRESSO, which can be implemented with minimal additional cost while significantly improving usability.
Despite its strengths, the current method has an important limitation related to database coverage. Although PubChem contains more than 100 million chemical structures, it does not include all possible compounds. If the correct structure is not included in the database, the present approach may fail to identify the structure or may even produce an incorrect assignment. In such cases, additional experimental information--such as extended NMR analysis or fragment-based interpretation of mass spectra--may help mitigate this limitation.
We are currently working on the next stage of this project, aiming to further automate and generalize the entire workflow. Our goal is to enable robust structure determination of unknown polycrystalline samples with minimal manual procedure.
For full experimental details and in-depth discussion, please refer to the original publication. 5
10. Acknowledgments
This project was carried out through a close and productive collaboration with the group of Prof. Michele R. Chierotti of the University of Turin. We gratefully acknowledge all members of the international research team, including Chiara Sabena (University of Turin) and Federica Bravetti (Goethe University), for their valuable contributions. We also thank our colleagues at JEOL Ltd., including Natsuki Miyauchi, Miho Nakafukasako, Yoshitaka Aoyama, Katsuo Asakura, Kiyotaka Konuma, and Masahiro Hashimoto, for their strong support with the SynergyED and HRMS measurements.
11. References
1 U. Kolb,* T. Gorelik, C. Kübel, M.T. Otten, D. Hubert, Ultramicroscopy, 107 (2007) 507- 513.
2 T. Gruene,* J.T. C. Wennmacher, C. Zaubitzer, J.J. Holstein, J. Heidler, A. Fecteau-Lefebvre, S. De Carlo, E. Müller, K.N. Goldie, I. Regeni, T. Li, G. Santiso-Quinones, G. Steinfeld, S. Handschin, E. van Genderen, J.A. van Bokhoven, G.H. Clever, R. Pantelic, Angew. Chem. Int. Ed., 57 (2018) 16313 -16317.
3 C.G. Jones, M.W. Martynowycz, J. Hattne, T.J. Fulton, B.M. Stoltz,* J.A. Rodriguez,* H.M. Nelson,* T. Gonen,* ACS Cent. Sci., 4, 1587 -1592 (2018)
4 C. Guzmán-Afonso, Y.-l. Hong, H. Colaux, H. Iijima, A. Saitow, T. Fukumura, Y. Aoyama, S. Motoki, T. Oikawa, T. Yamazaki, K. Yonekura, Y. Nishiyama,* Nat. Commun. 10 (2019) 3537.
5 C. Sabena, F. Bravetti, N. Miyauchi, M. Nakafukasako, Y. Aoyama, K. Asakura, K. Konuma, M. Hashimoto, Y. Nishiyama,* M.R. Chierotti,* Commun. Chem. 9 (2026) 97. DOI: 10.1038/s42004-026-01902-1
6 R.B. Cody,* J.A. Laramee, H.D. Durst, Anal. Chem. 77 (2005) 2297-2302.
7 https://pubchem.ncbi.nlm.nih.gov/
8 P. Hodgkinson,* Prog. Nucl. Magn. Reson. Spectrosc., 118-119 (2020) 10-53.
9 L. Rajput,† M. Banik,† J.S.R. Yarava, S. Joseph, M.K. Pandey, Y. Nishiyama,* G.R. Desiraju,* IUCrJ 4 (2017) 466-475.
10 D. Bernasconi, S. Bordignon, F. Rossi, E. Priola, C. Nervi, R. Gobetto, D. Voinovich, D. Hasa, N.T. Duong, Y. Nishiyama, M.R. Chierotti,* Cryst. Growth Des., 20 (2020) 906-915.
11 T. Steiner,* I. Majerz,* C.C. Wilson,* Angew. Chem. Int. Ed. 40 (2001) 2651-2654.
12 N.T. Duong, F. Rossi, M. Makrinich, A. Goldbourt, M.R. Chierotti, R. Gobetto, Y. Nishiyama,* J. Magn. Reson. 308 (2019) 106559.
13 P. Giannozzi, S. Baroni, N. Bonini, M. Calandra, R. Car, C. Cavazzoni, D. Ceresoli, G. L. Chiarotti, M. Cococcioni, I. Dabo, A. Dal Corso, S. Fabris, G. Fratesi, S. de Gironcoli, R. Gebauer, U. Gerstmann, C. Gougoussis, A. Kokalj, M. Lazzeri, L. Martin-Samos, N. Marzari, F. Mauri, R. Mazzarello, S. Paolini, A. Pasquarello, L. Paulatto, C. Sbraccia, S. Scandolo, G. Sclauzero, A. P. Seitsonen, A. Smogunov, P. Umari, R. M. Wentzcovitch, J. Phys.: Condens. Matter 21 (2009) 395502.
14 P. Giannozzi,* O. Andreussi, T. Brumme, O. Bunau, M.B. Nardelli, M. Calandra, R. Car, C. Cavazzoni, D. Ceresoli, M. Cococcioni, N. Colonna, I. Carnimeo, A. Dal Corso, S. de Gironcoli, P. Delugas, R.A. DiStasio Jr, A. Ferretti, A. Floris, G. Fratesi, G. Fugallo, R. Gebauer, U. Gerstmann, F. Giustino, T. Gorni, J. Jia, M. Kawamura, H.-Y. Ko, A. Kokalj, E. Küçükbenli, M. Lazzeri, M. Marsili, N. Marzari, F. Mauri, N.L. Nguyen, H.-V. Nguyen, A. Otero-de-la-Roza, L. Paulatto, S. Poncé, D. Rocca, R. Sabatini, B. Santra, M. Schlipf, A.P. Seitsonen, A. Smogunov, I. Timrov, T. Thonhauser, P. Umari, N. Vast, X. Wu, S. Baroni, J. Phys.: Condens. Matter 29 (2017) 465901.
12. Related Products
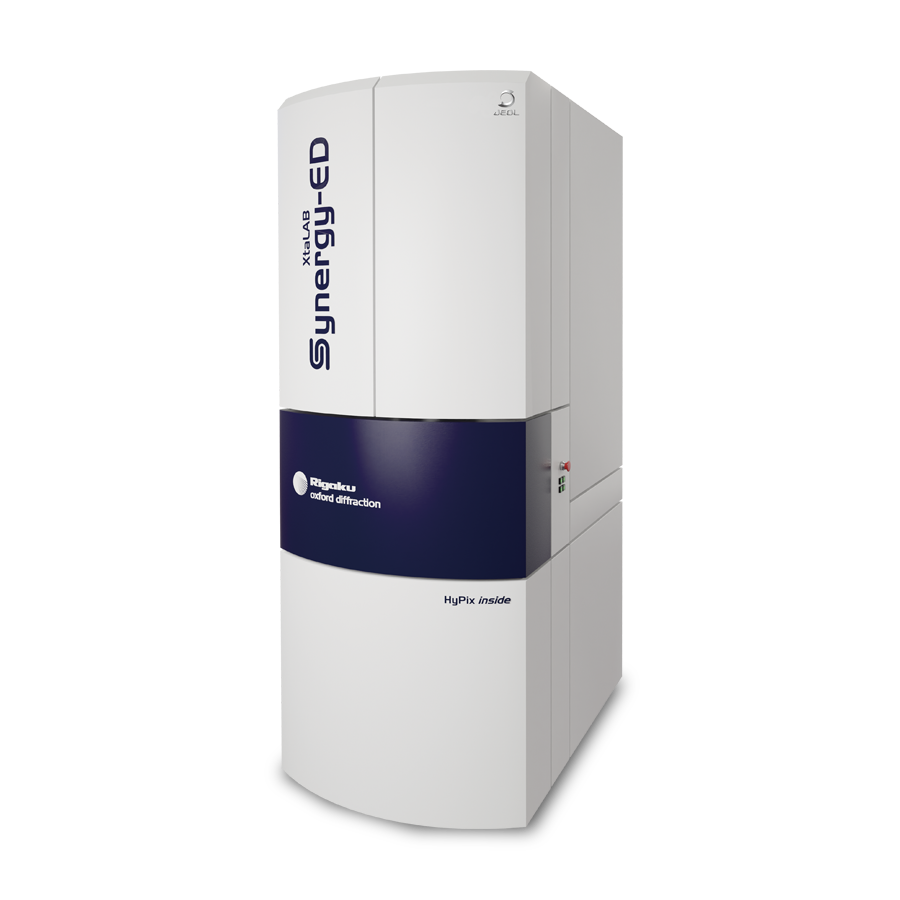
Electron DiffractometerXtaLAB Synergy-ED
XtaLAB Synergy-ED is a completely new electron diffractometer born from the synergy of Rigaku and JEOL's core technologies.
It integrates Rigaku's high-speed, ultra-sensitive detector HyPix-ED, the "CrysAlisPro for ED" software that covers everything from measurement to structural analysis, and JEOL's electron beam generation and control technologies that have been refined over many years. By integrating the flow from selection of measurement samples (nanocrystals) to data collection and analysis, electron diffraction structure analysis can be easily used by non-specialists who lack the expertise in electron microscopy and crystallography that is conventionally required.
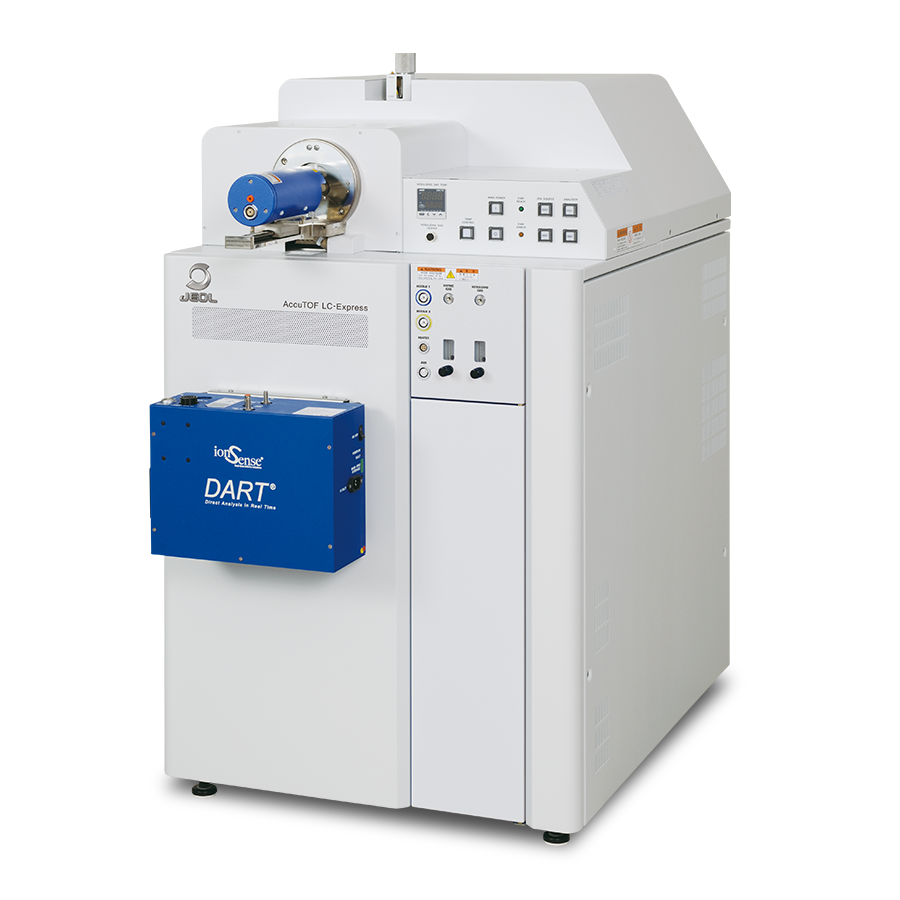
JMS-T100LP AccuTOF LC-ExpressAtmospheric pressure ionizationhigh-resolution time-of-flightmass spectrometer
The AccuTOF™ LC-Express is the fourth generation of the successful AccuTOF™ LC series, a robust and easy-to-maintain, high-throughput mass spectrometer aiming for high productivity with multiple ionization methods.
JEOL's unique ionization technology, DART™ (Direct Analysis in Real Time) can rapidly provide accurate mass information. It is also easy to replace the ion source with the electrospray ionization (ESI) source for LC/MS operation, or with ColdSpray ionization (CSI) source. Thus, the AccuTOF™ LC-Express can satisfy a variety of research needs in organic chemistry and material science.
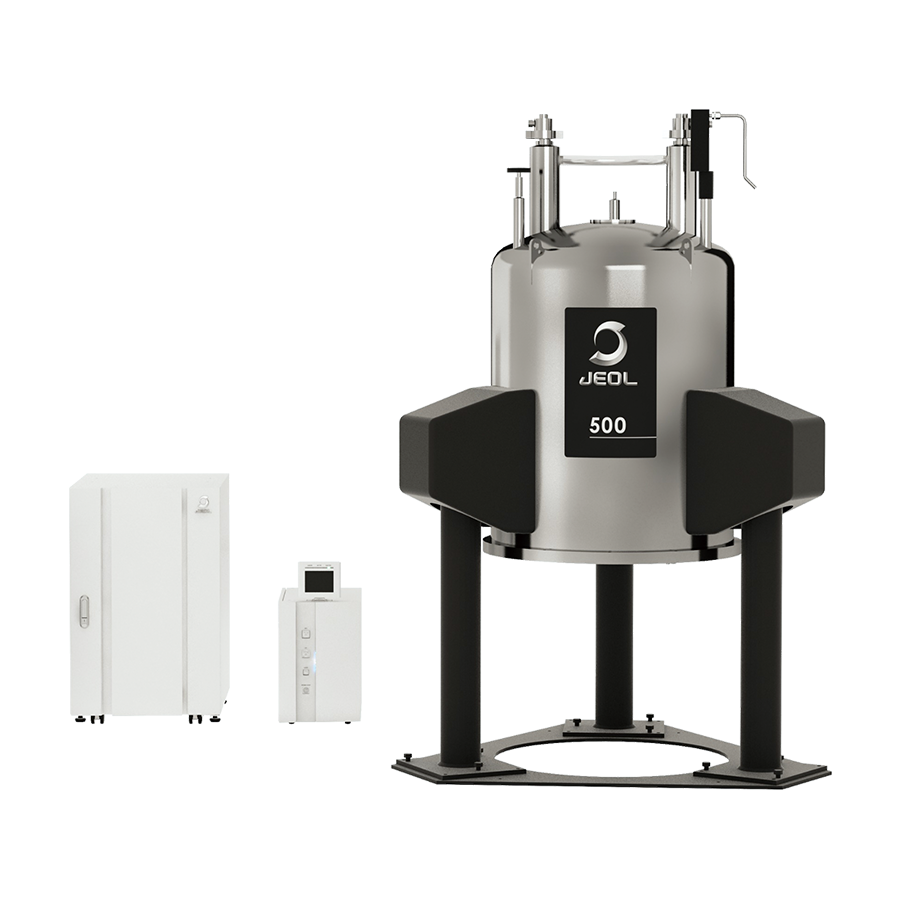
NMR spectrometer ECZ Luminous™ JNM-ECZL series FT NMR
The ECZ Luminous™ (JNM-ECZL series) is an FT NMR spectrometer equipped with state-of-the-art digital and high frequency technology. The highly integrated Smart Transceiver System, a high-speed, high-precision digital high-frequency control circuit, enables further miniaturization and high reliability of the spectrometer. It is capable of high-field and solid-state NMR measurements while maintaining the size of a conventional low-field solution NMR system.
The new Multi Frequency Drive System enables multi-resonance measurements in a standard configuration, providing a wider range of solutions. We hope you enjoy the world of ECZ Luminous™.
JEOL Ltd.
Since its foundation in 1949, JEOL has been committed to the development
of cutting-edge scientific and metrology instruments, industrial and medical equipment.
Today,
many of our products are used throughout the world and we are highly regarded as a truly global
company.
Aiming to be a 'top niche company that supports science and technology around the
world', we will continue to respond precisely to the increasingly sophisticated and diverse needs
of our customers.