Development of peak extraction method from a high-resolution MALDI-TOF mass spectrum by machine learning focusing on peak shape, and an application to synthetic polymer analysis
MSTips No.352
Matrix-assisted laser desorption/ionization time-of-flight mass spectrometer (MALDI-TOFMS) is a powerful tool in the analysis of polymers. High-resolution MALDI-TOFMS facilitates the identification of polymer series by the elemental composition of repeating units and end groups, and allows the calculation of the molecular weight distribution of polymers from the ionic intensity distribution. In actual industrial material analysis, mixtures of polymers with different molecular weight distributions and end groups are analyzed, and Kendrick Mass Defect (KMD) analysis, which allows an overview of complex mass spectra, is being used. KMD analysis can visualize the number and relativfe amount of polymer series contained in a complex mass spectrum because a polymer series is visualized as a straight line on a diagram called KMD plot. Another feature is that it facilitates the discovery of trace components. Since the KMD plot is created by extracting peaks from the mass spectrum, it is important to properly distinguish between the peaks to be analyzed and the noise peaks. Mass spectra of MALDI-TOFMS often show noise peaks in which the ion intensity decreases exponentially with increasing m/z. These peaks are broad, distorted in shape and poorly reproducible. In the mass spectrum measured using the high-resolution MALDI-TOFMS JMS-S3000 “SpiralTOF™” series, the peaks to be analyzed have narrow peak widths, making it possible to visually distinguish them from non-informative peaks. However, performing identification over the entire mass spectrum and including minor peaks is time consuming and inefficient. In general automatic peak determination, the peak area value is used as the ion intensity. Therefore, when a wide noise peak has the same height as a peak to be analyzed, it may be difficult to uniformly sort it out with a threshold value because the ion intensity becomes higher. Figure 1 shows the profile mass spectrum and the peaks to be analyzed and noise peaks after general peak determination. In the peak list, the peaks to be analyzed are colored red, and the noise peaks green. Weak noise peaks were observed every 1 u in the profile spectrum. In the profile spectrum, the peaks to be analyzed can be identified based on the peak width, but after the peak detection, the ion intensity (peak area) of the noise peaks becomes relatively large, making it difficult to identify the peaks to be analyzed. In order to solve this problem, this report describes the development of a method for identifying whether a peak in a mass spectrum is an analysis target peak or a noise peak using machine learning with supervised data that focuses on peak shape.
Experiment
To generate data for machine learning, polyethylene glycols (PEG) with average molecular weights of 400, 600, 1000, and 2000 were prepared at 10 mg/mL and then mixed with 1:1:2:4 (v/v/v/v) ratio (PEG mixture). In addition, a 100-fold diluted PEG mixture was prepared as a low-concentration PEG mixture.。DCTB (10 mg/mL) was used as the matrix, and sodium trifluoroacetate (1 mg/mL) was used as the cationizing agent. Mass spectra were acquired using JMS-S3000 “SpiralTOF™-plus” in SpiralTOF positive ion mode. Machine learning denoising is implemented in msPeakFinder. KMD analysis was performed with msRepeatFinder.
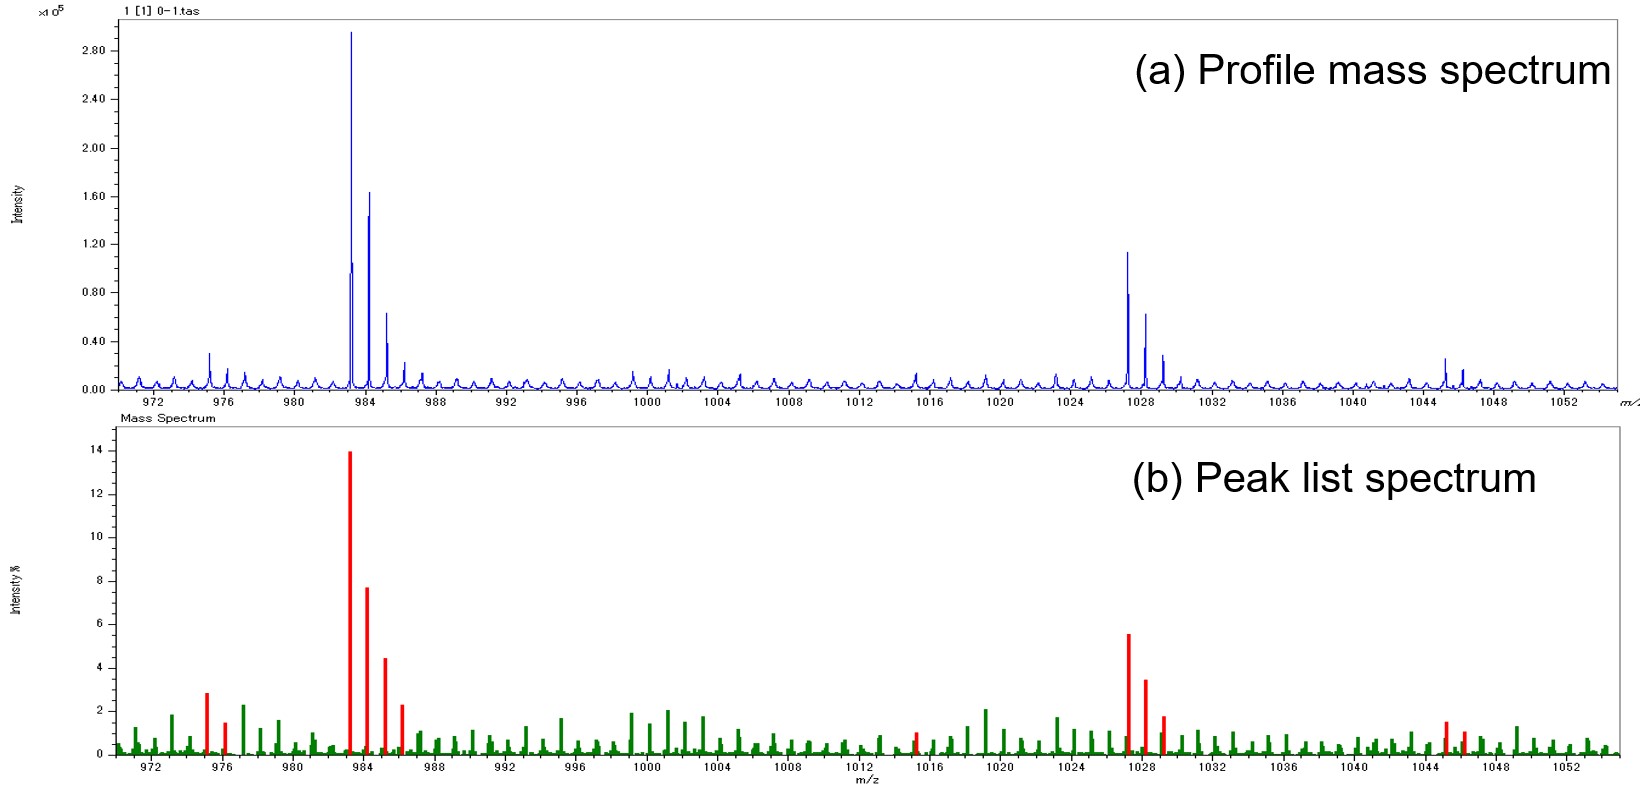
Figure 1 Profile mass spectrum of high-resolution MALDI-TOFMS (a) and peak list spectrum using conventional peak detection method.
Machine learning method
For machine learning, we adopted Conditional Generative Adversarial Network (cGAN). Since cGAN outputs generated data according to the input condition data, it can be considered as a conversion from condition data to generated data. This method is based on the concept of inputting the observed mass spectrum and outputting a pseudo-mass spectrum with noise peaks removed, and applied it to noise peak removal. Figure 2 shows a flow chart of the procedure for creating a machine learning model for this method. In the flow chart, the yellow background is human intervention, and the green is automatic. First, we acquired a mass spectrum of the PEG mixture for training data (Figure 3a). After the mass spectrum acquired was subjected to peak detection by a conventional method and a peak list was created, the peaks to be analyzed were determined and extracted by an expert based on the peak shape (Fig. 3b red arrow). The peaks to be analyzed were set to a constant height regardless of the observed ion intensity, and the peak shape was created with a Gaussian distribution to create a pseudo-mass spectrum (Figure 3c). In this method, the acquired mass spectrum and the pseudo mass spectrum were paired and used as the original data for the training data. Now, it takes time and effort to acquire a large number of mass spectra in order to increase the number of training data. Therefore, we created a total of 1,600 pairs of training data from one original data by dividing the original data every 1,024 points and changing the starting point of the division five times. A machine learning model was generated using the training data created in this way. Figure. 4 shows the conceptual diagram. The acquired mass spectrum is converted into a pseudo mass spectrum by the Generator. The quality of the generator was improved by discriminating the combination of this measured mass spectrum and the pseudo mass spectrum converted through the generator, and the combination of the measured mass spectrum and the pseudo mass spectrum of the training data, with the discriminator.
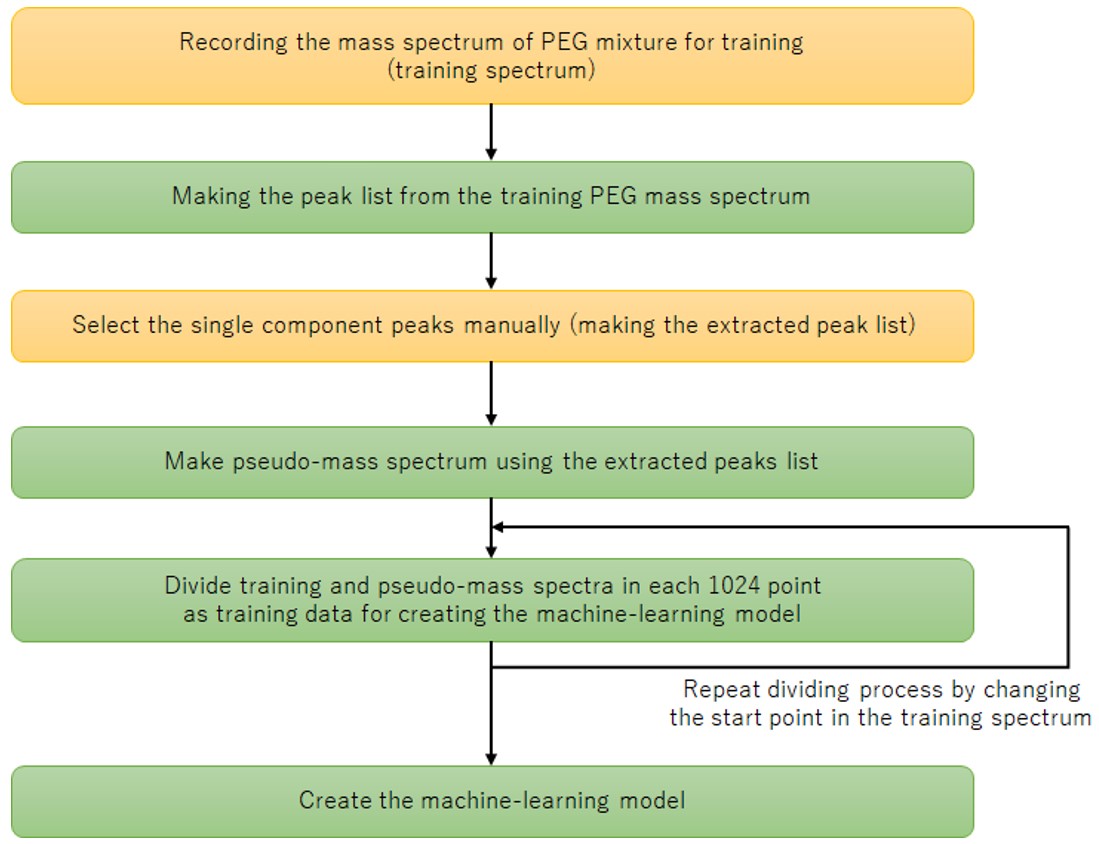
Figure 2 Flowchart of making the machine learning model.
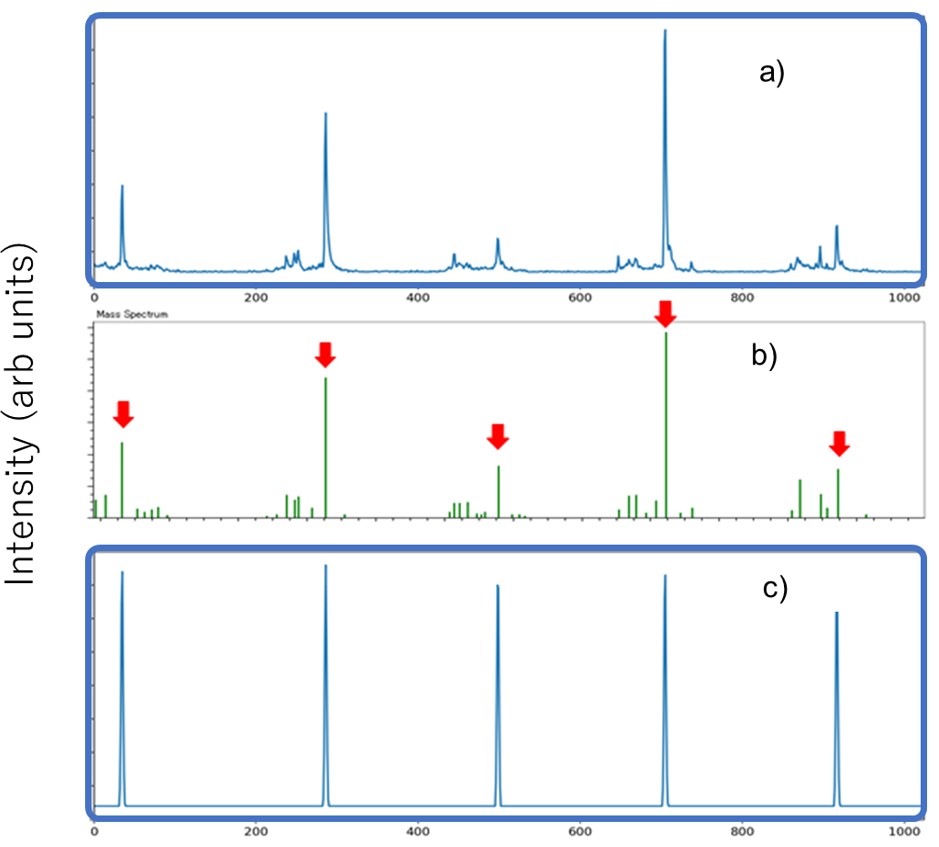
Figure 3 The relationship between profile mass spectrum(a), peak list(b) and pseudo-mass spectrum(c).
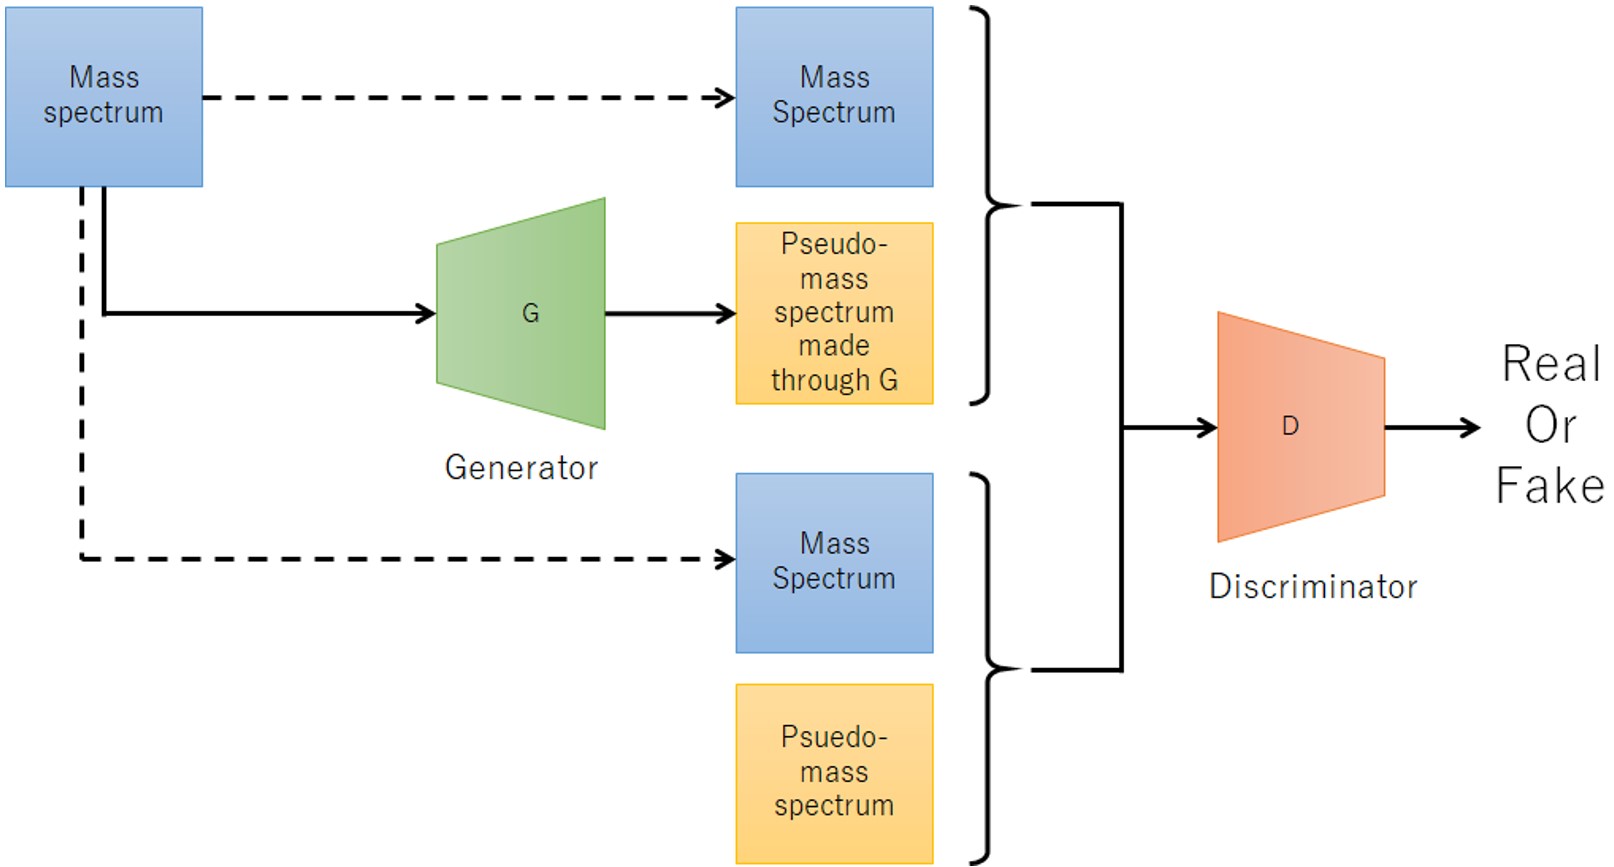
Figure 4 The scheme of making the machine learning model using cGAN.
Validation and application of the machine learning model
Next, the procedure for actual noise removal using the generated machine learning model is shown (Figure 5). In the flow chart, the yellow background is human intervention, and the green is automatic. The acquired mass spectrum is subjected to peak detection by the conventional method, and in parallel with this, it is divided into 1,024 points and converted into pseudo mass spectra using the machine learning model of the peaks determined by the conventional method, only peaks that match the peak positions of the pseudo mass spectrum are left, and a noise-removed peak list is generated. In other words, the m/z and ion intensity of the peak list extracted by this method are those of the conventional method. Here, we tried to remove noise peaks from the PEG mixture mass spectrum, which was used to create training data. The results are summarized in Table 1. A total of 4,390 peaks were detected from the mass spectrum of the PEG mixture by the conventional method. Among them, 1,265 peaks in the upper left and 3,105 peaks in the lower right (99.5% of the total) match the results of the judgments made by the machine learning model with the judgments made manually when the training data was created. The 14 peaks on the upper right were determined as peaks to be analyzed when the machine learning model was created, but were determined as noise peaks by the machine learning model. It was confirmed that these peak shapes were slightly distorted and difficult to judge even by an expert. The six peaks on the lower left were determined as noise peaks when the training data was created, but were determined as peaks to be analyzed by the machine learning model. It was confirmed that these were caused by human error when preparing the training data. After that, machine learning was performed again with the training data that corrected this mistake. We believe that it is effective to validate the model by using the mass spectrum that was used to create the machine learning model. Finally, peak extraction was performed using the mass spectrum of low-concentration PEG, and the results developed into a KMD plot are shown in Figure 6. Figure 6a is the measured mass spectrum and Figure 6b is the KMD plot. The red points in the KMD plot were determined as peaks to be analyzed by machine learning, and the green points were determined as noise peaks. From this result, it can be seen that the PEG series are well visualized by removing noise, especially in the region of m/z < 1,500.
Summary
As described above, we were able to show that the KMD analysis can be performed more efficiently by removing the noise peaks that are often observed in the low-m/z region from the high-resolution MALDI-TOFMS data using a machine learning model.
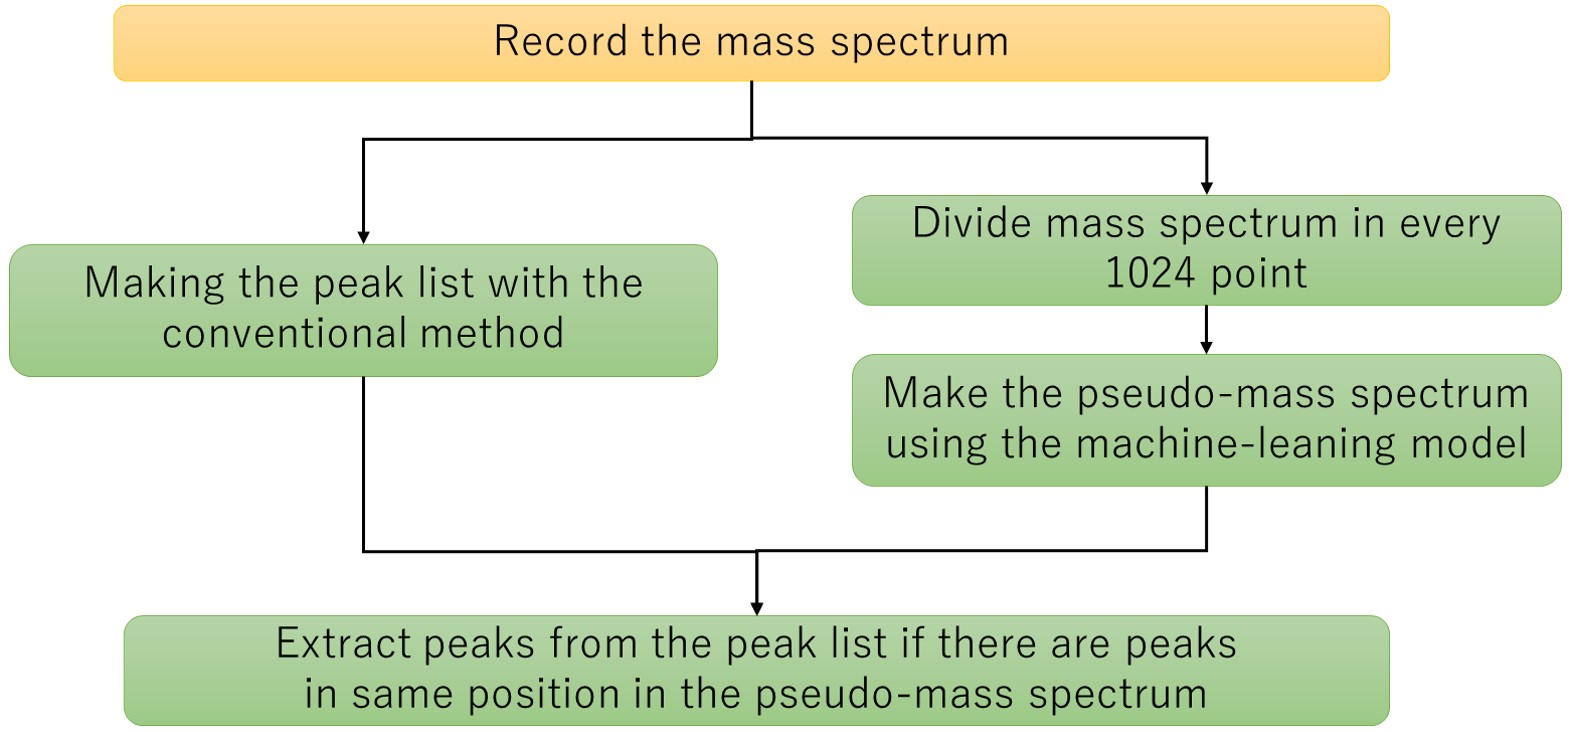
Figure 5 Flowchart of making the extract peak list by the machine learning model.
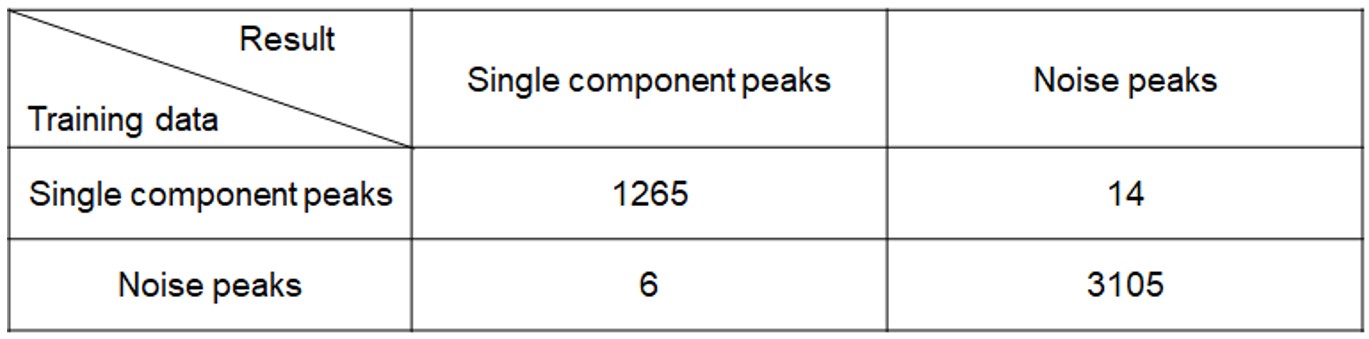
Table 1 Comparison between the peak lists of PEG mixture used as the training data and the one extracted by the machine learning model.
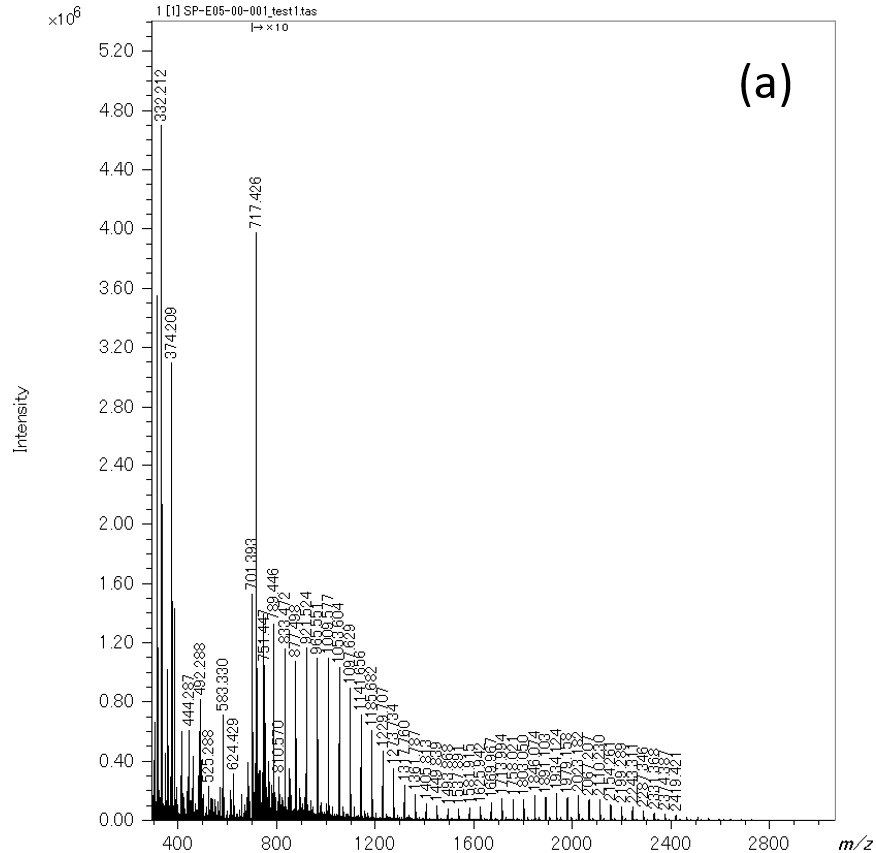
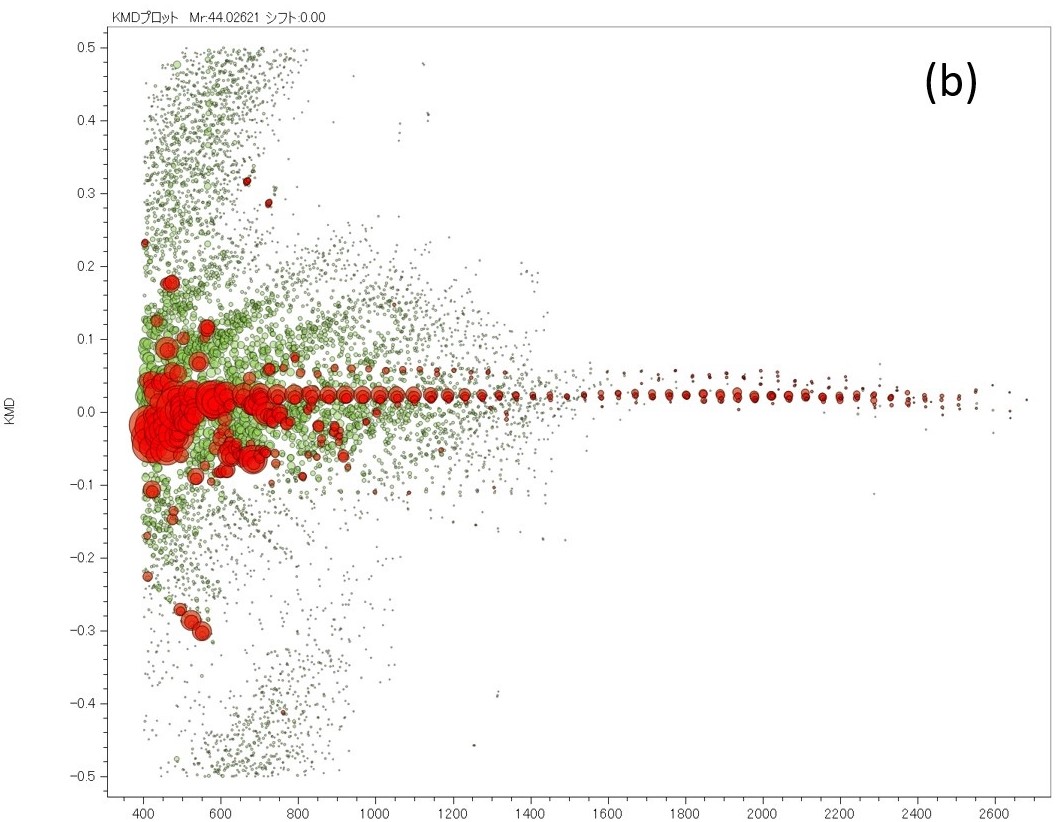
Figure 6 Mass spectrum of low concentration PEG mixture(a) and the KMD plot of the extracted peak list (red) and the noise peal list (green) separated by the machine learning model.
Solutions by field
Are you a medical professional or personnel engaged in medical care?
No
Please be reminded that these pages are not intended to provide the general public with information about the products.