Comparative analysis of mechanical pencil lead by TG-MS
MSTips No.265
Overview
Thermogravimetry (TG) is used to measure weight changes of samples under programmed heat conditions. A system combining thermogravimetry/differential thermal analysis (TG/DTA) with mass spectrometry (MS) is called a TG-MS system, and can be used for both qualitative and quantitative mass spectral analysis of evolved gas from the TG furnace.
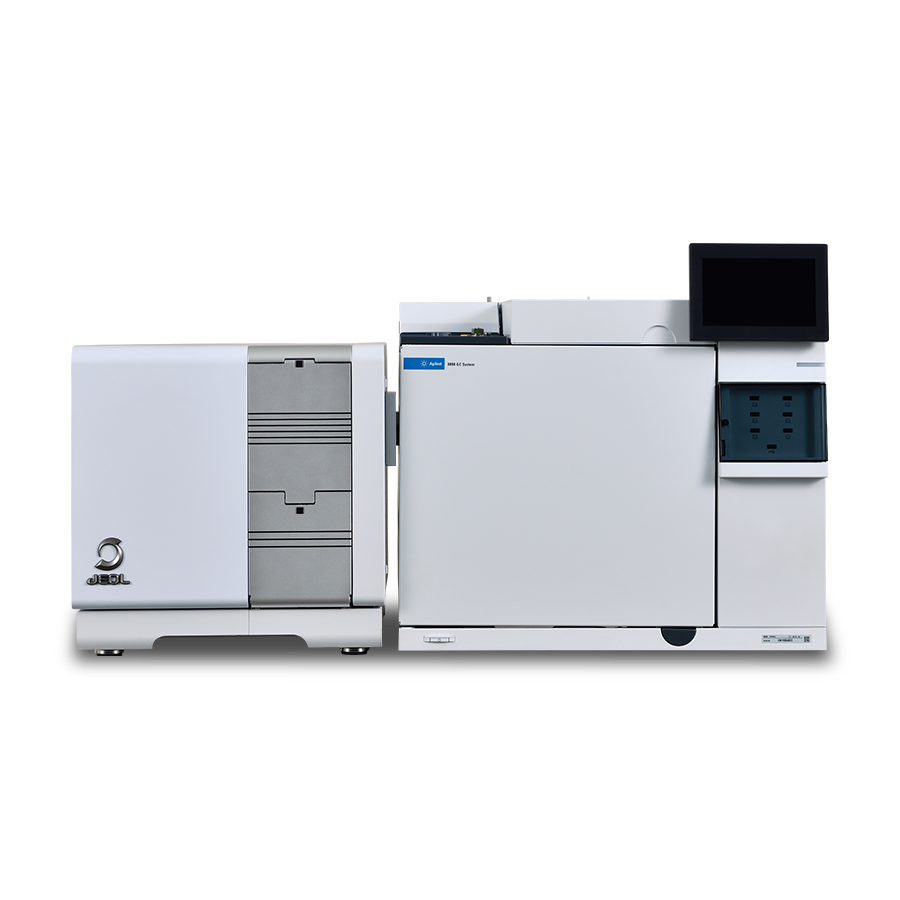
The TG-MS technique can also be used to analyze the thermal-decomposition process. This application note shows an example of comparative analysis of mechanical-pencil leads of different performances, grades, and manufacturers. These leads are made by baking a mixture of graphite and resin, and then dipping it in oil for hardness and smoothness. Since the resin is carbonized and baked out, the lead is composed of only carbon and oil. In this application note, we show TG-MS analysis results for these mechanical-pencil leads using a “STA2500 Regulus” system (NETZSCH) and a gas chromatography–quadrupole mass spectrometry (GC/QMS) “JMS-Q1500GC” system (JEOL).
Equipment
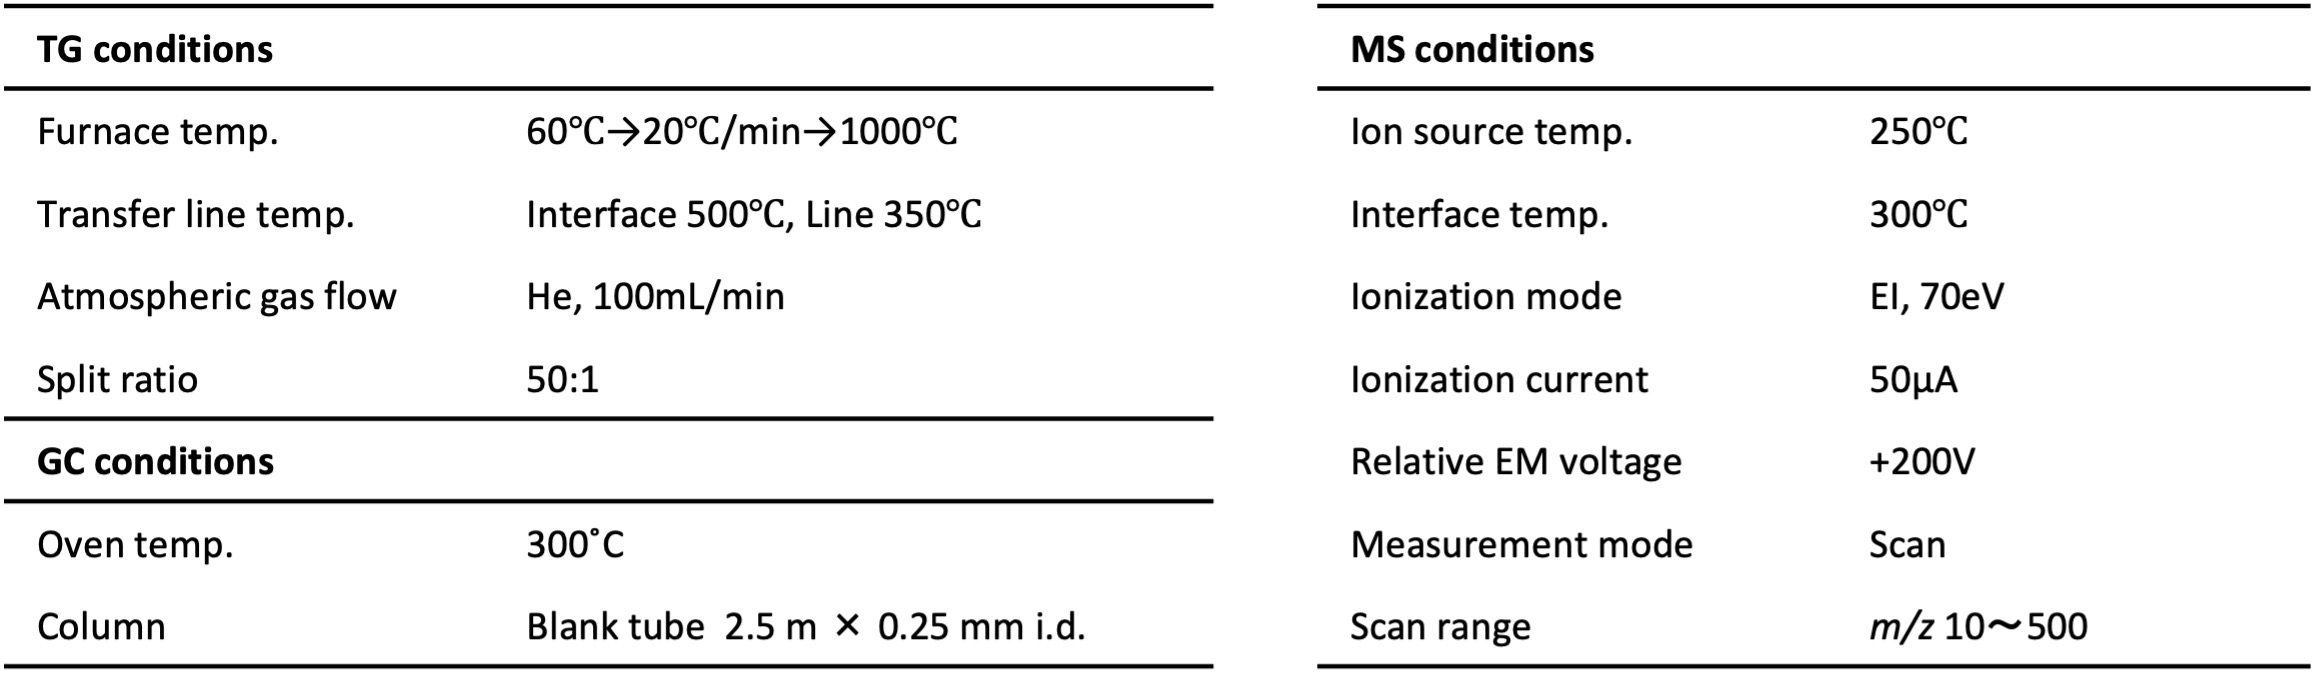
Commercially available mechanical-pencil leads (each about 25 mg, 0.5 mm × 60 mm) were measured as samples. These were crushed and put into TG sample cups. Differences in blackness (4H, HB, 4B), grade (2 types), and manufacturers (4 companies) were compared. Table 1 shows the TG-MS measurement conditions.
Table 1. TG-MS measurement conditions.
Results
Figure 1 shows the TG curve and the total ion current chromatogram (TICC) for HB pencil leads from the manufacturer (A). Around 300˚C, 12% weight loss was observed, which was attributed to oil evaporation. At the same temperature, a strong TICC peak was observed.
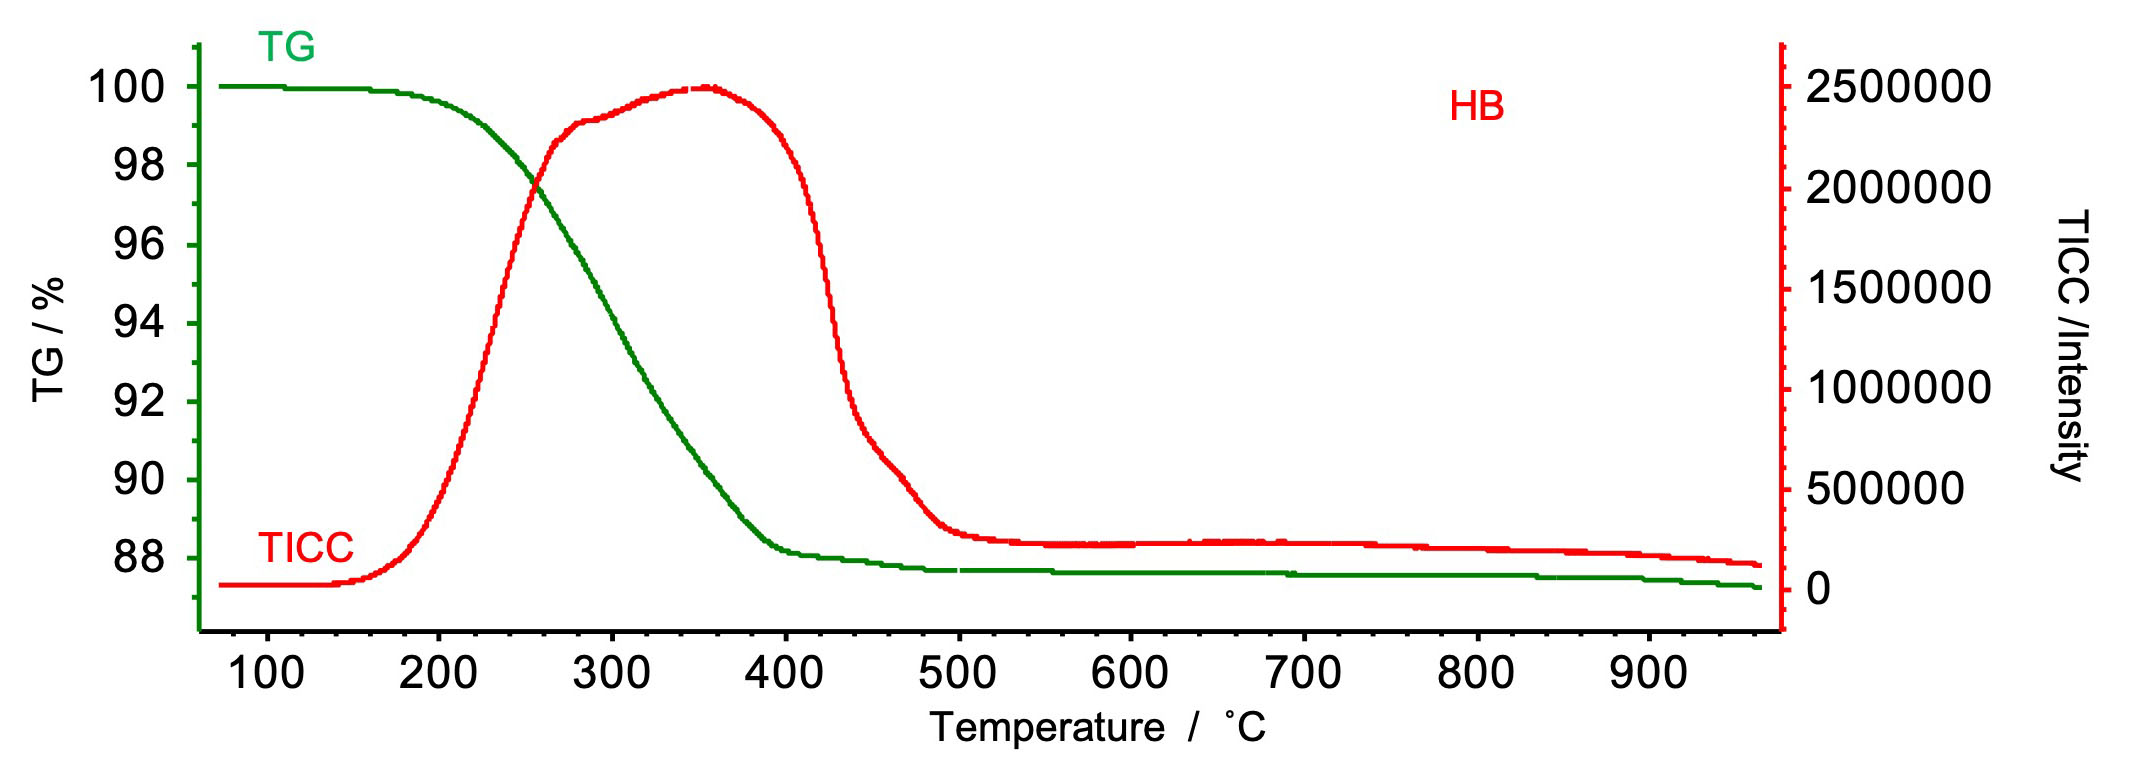
Figure 1. TG curve and TICC.
The mass spectrum from the observed TICC peak is shown in Figure 2. The mass spectrum was likely a hydrocarbon based on a NIST Library search. This result suggests that the 12% weight loss came from hydrocarbon evaporation.
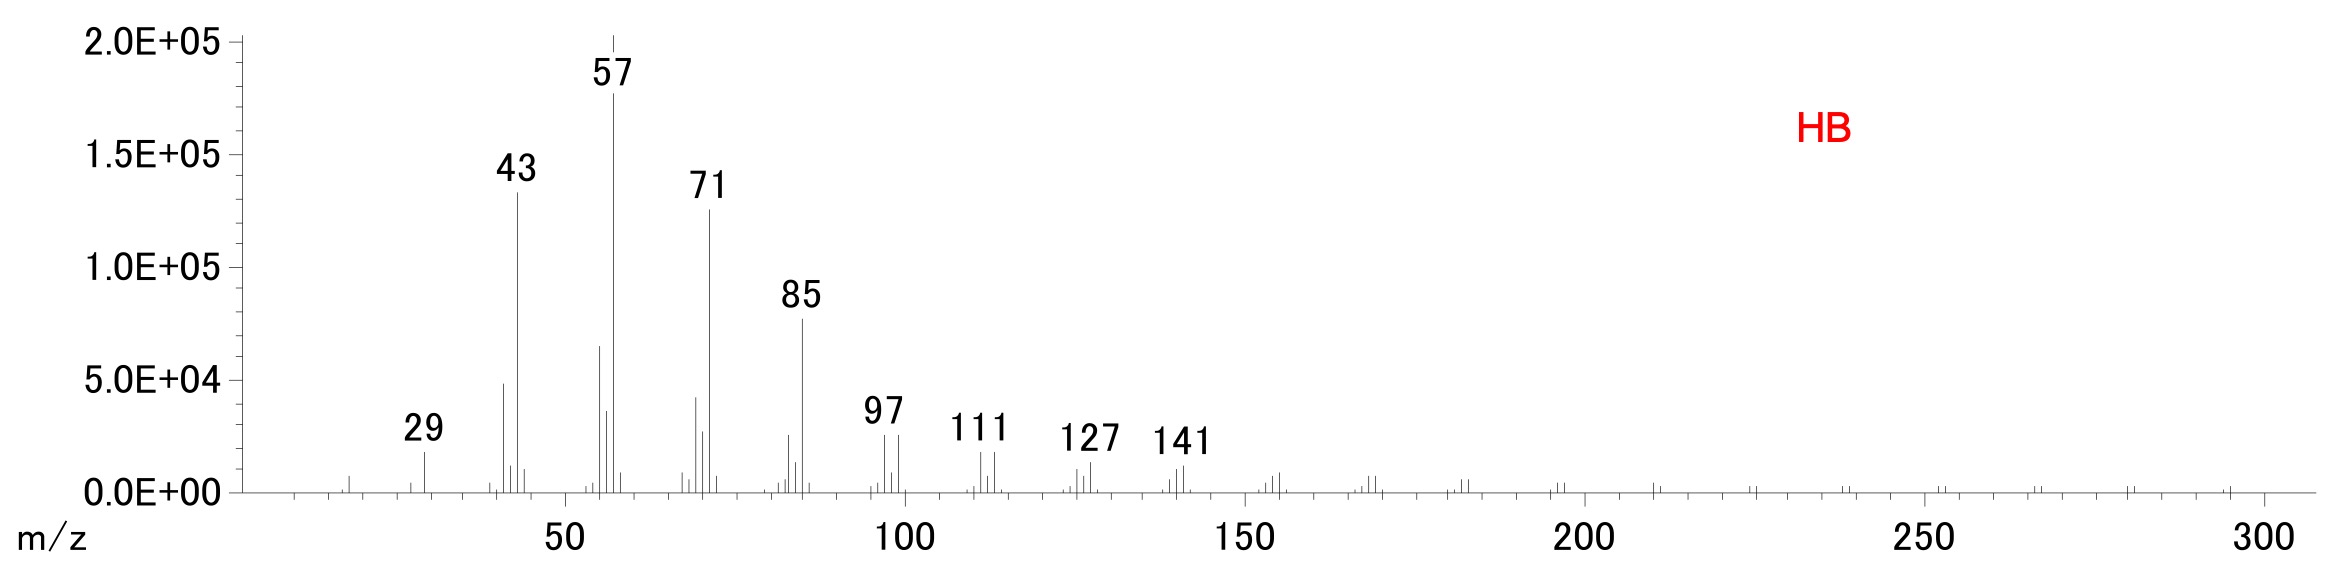
Figure 2. Mass spectrum.
Three pencil leads with different degrees of blackness (4H, HB, 4B) were compared. All were from the same manufacturer (A). Blackness increases in the order of 4H → HB → 4B. TG curves and TICCs for all three levels of lead blackness are shown in Figures 3 and 4. Since the mass-spectrum patterns of 4H and 4B were same as that of HB (Fig. 2), the oil type was thought to be the same. As blackness increased, weight loss increased to 2%,12%,and 15% due to the greater amount of oil. Intensity of the TICC peak was correlated with weight loss.
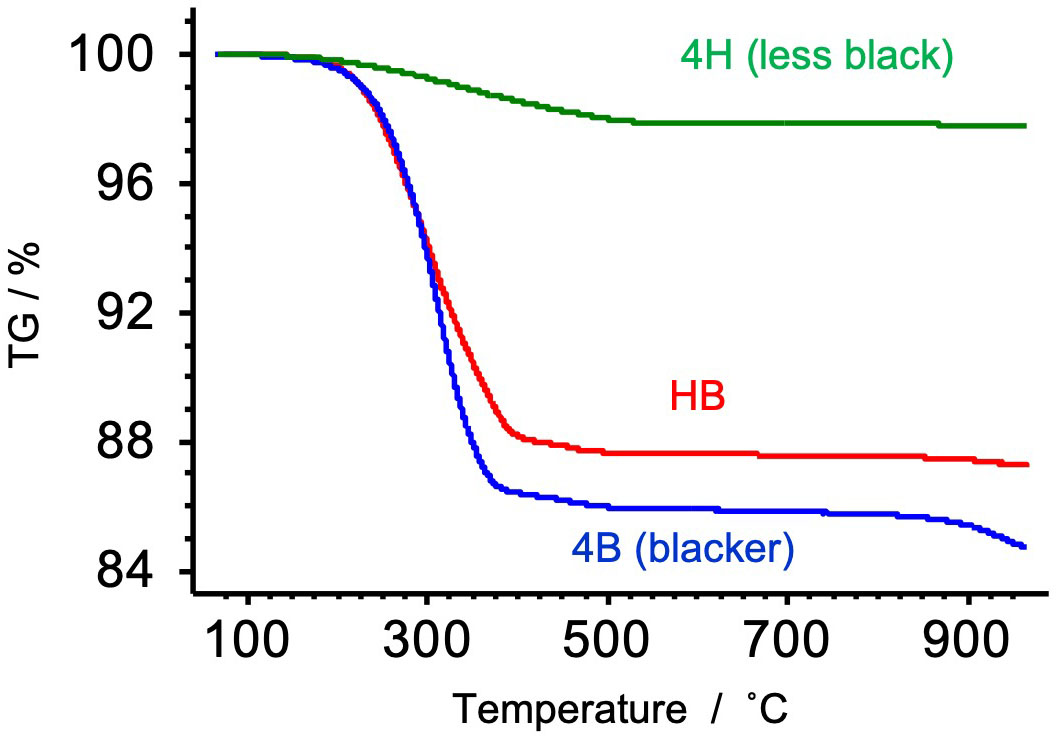
Figure 3. TG curves.
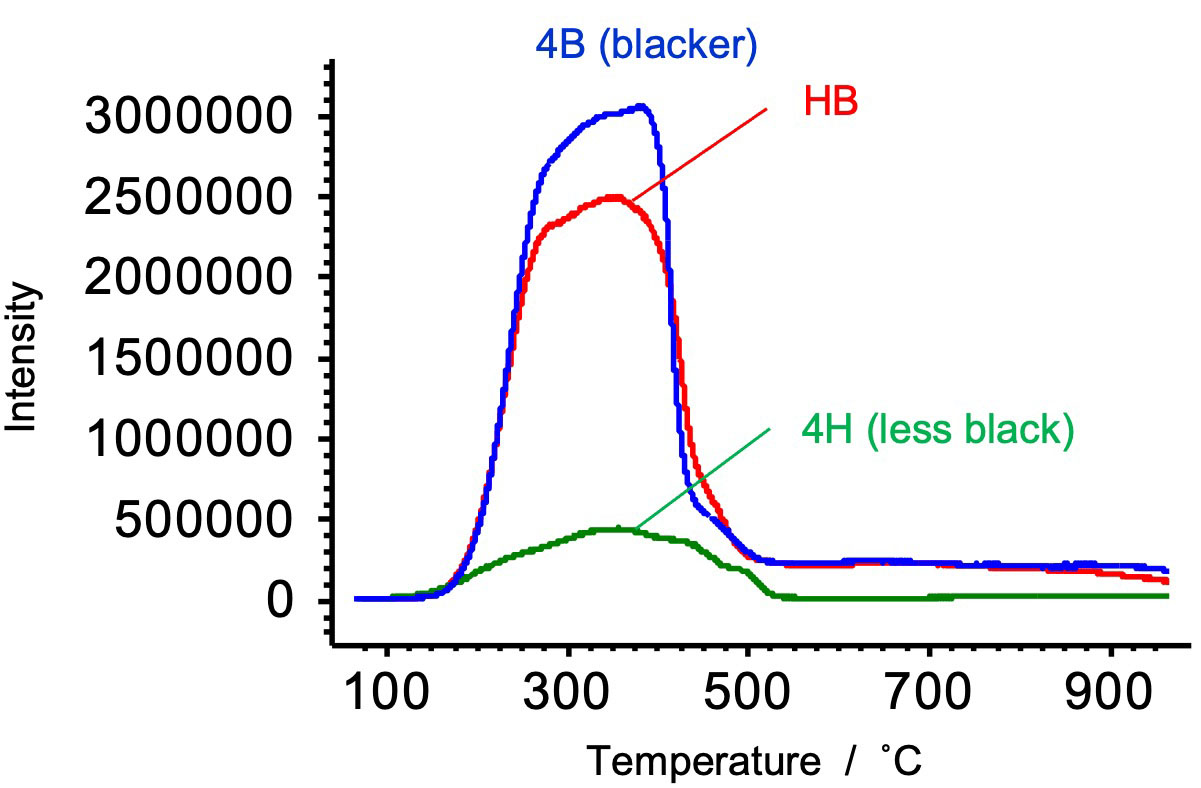
Figure 4. TICCs.
Differences in grade between two of manufacturer A’s products were compared. Blackness was the same for both (HB). The product introduction explained that grade A is structurally stronger and higher-priced than grade B. TG curves and TICCs for both grades are shown in Figures 5 and 6. The mass-spectrum pattern of the TICC peak was the same as in Figure 2, so the oil type was thought to be the same in both grades. Weight loss and intensity of TICC peak were almost the same. The amount of oil was not markedly different between grades A and B.
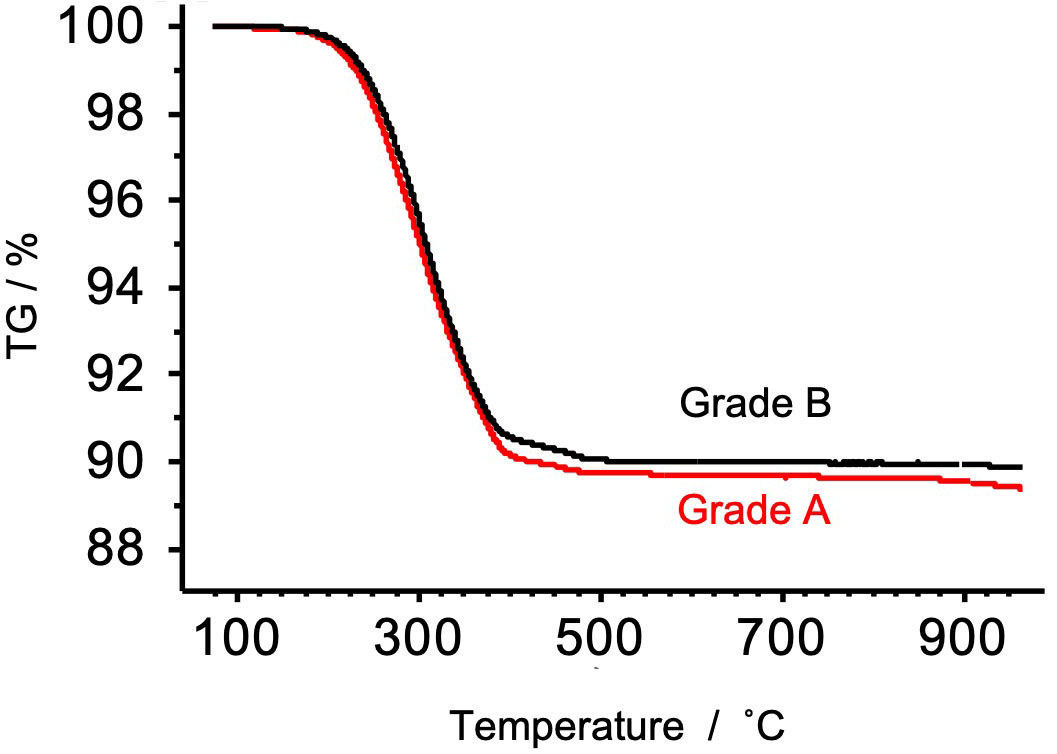
Figure 5. TG curves.
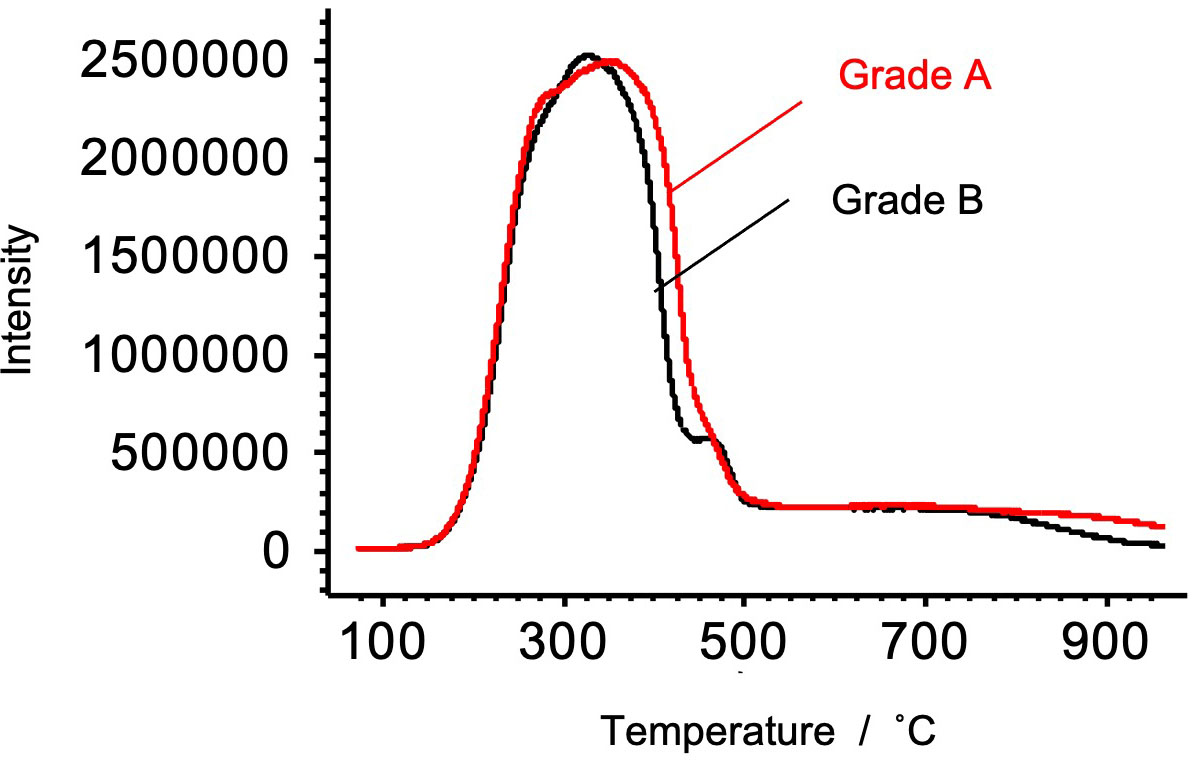
Figure 6. TICCs.
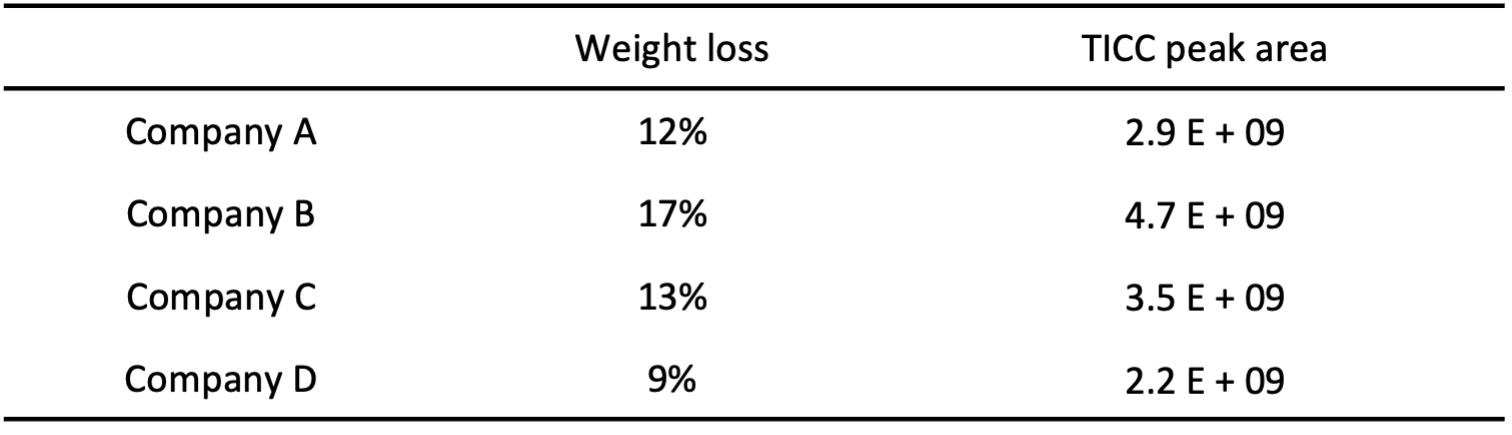
Leads from four different manufacturers were compared. Blackness was the same for all four (HB). Figure 7 shows TG curves, Figure 8 shows TICCs, and Table 2 shows value of weight loss and TICC peak area. Based on TG results for the same level of blackness, the amount of oil seems to differ by manufacturer.
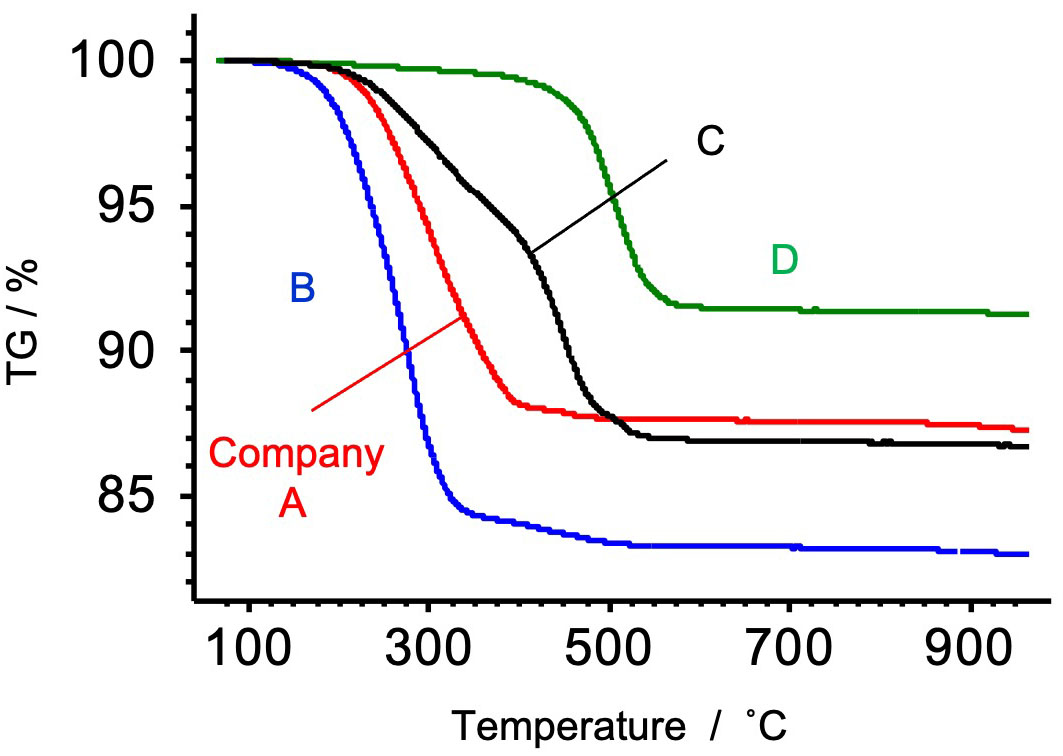
Figure 7. TG curves.
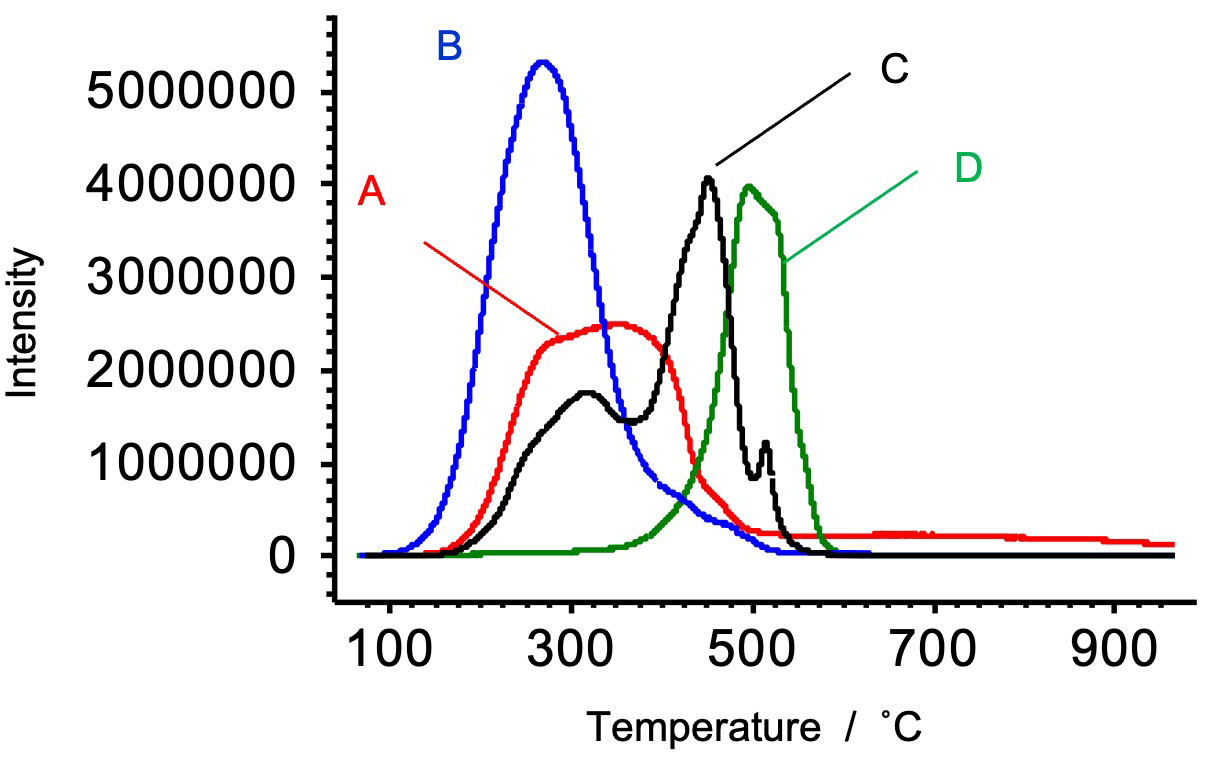
Figure 8. TICCs.
Table 2. Values of weight loss and TICC peak area.
The mass spectra of TICC peaks are shown in Figure 9. Mass spectra of companies A and B had almost the same peak pattern (top), and the same was observed for companies C and D (bottom). Per NIST Library search results, the upper mass spectrum was thought to be hydrocarbon oil, while the bottom mass spectrum suggested a silicone oil.
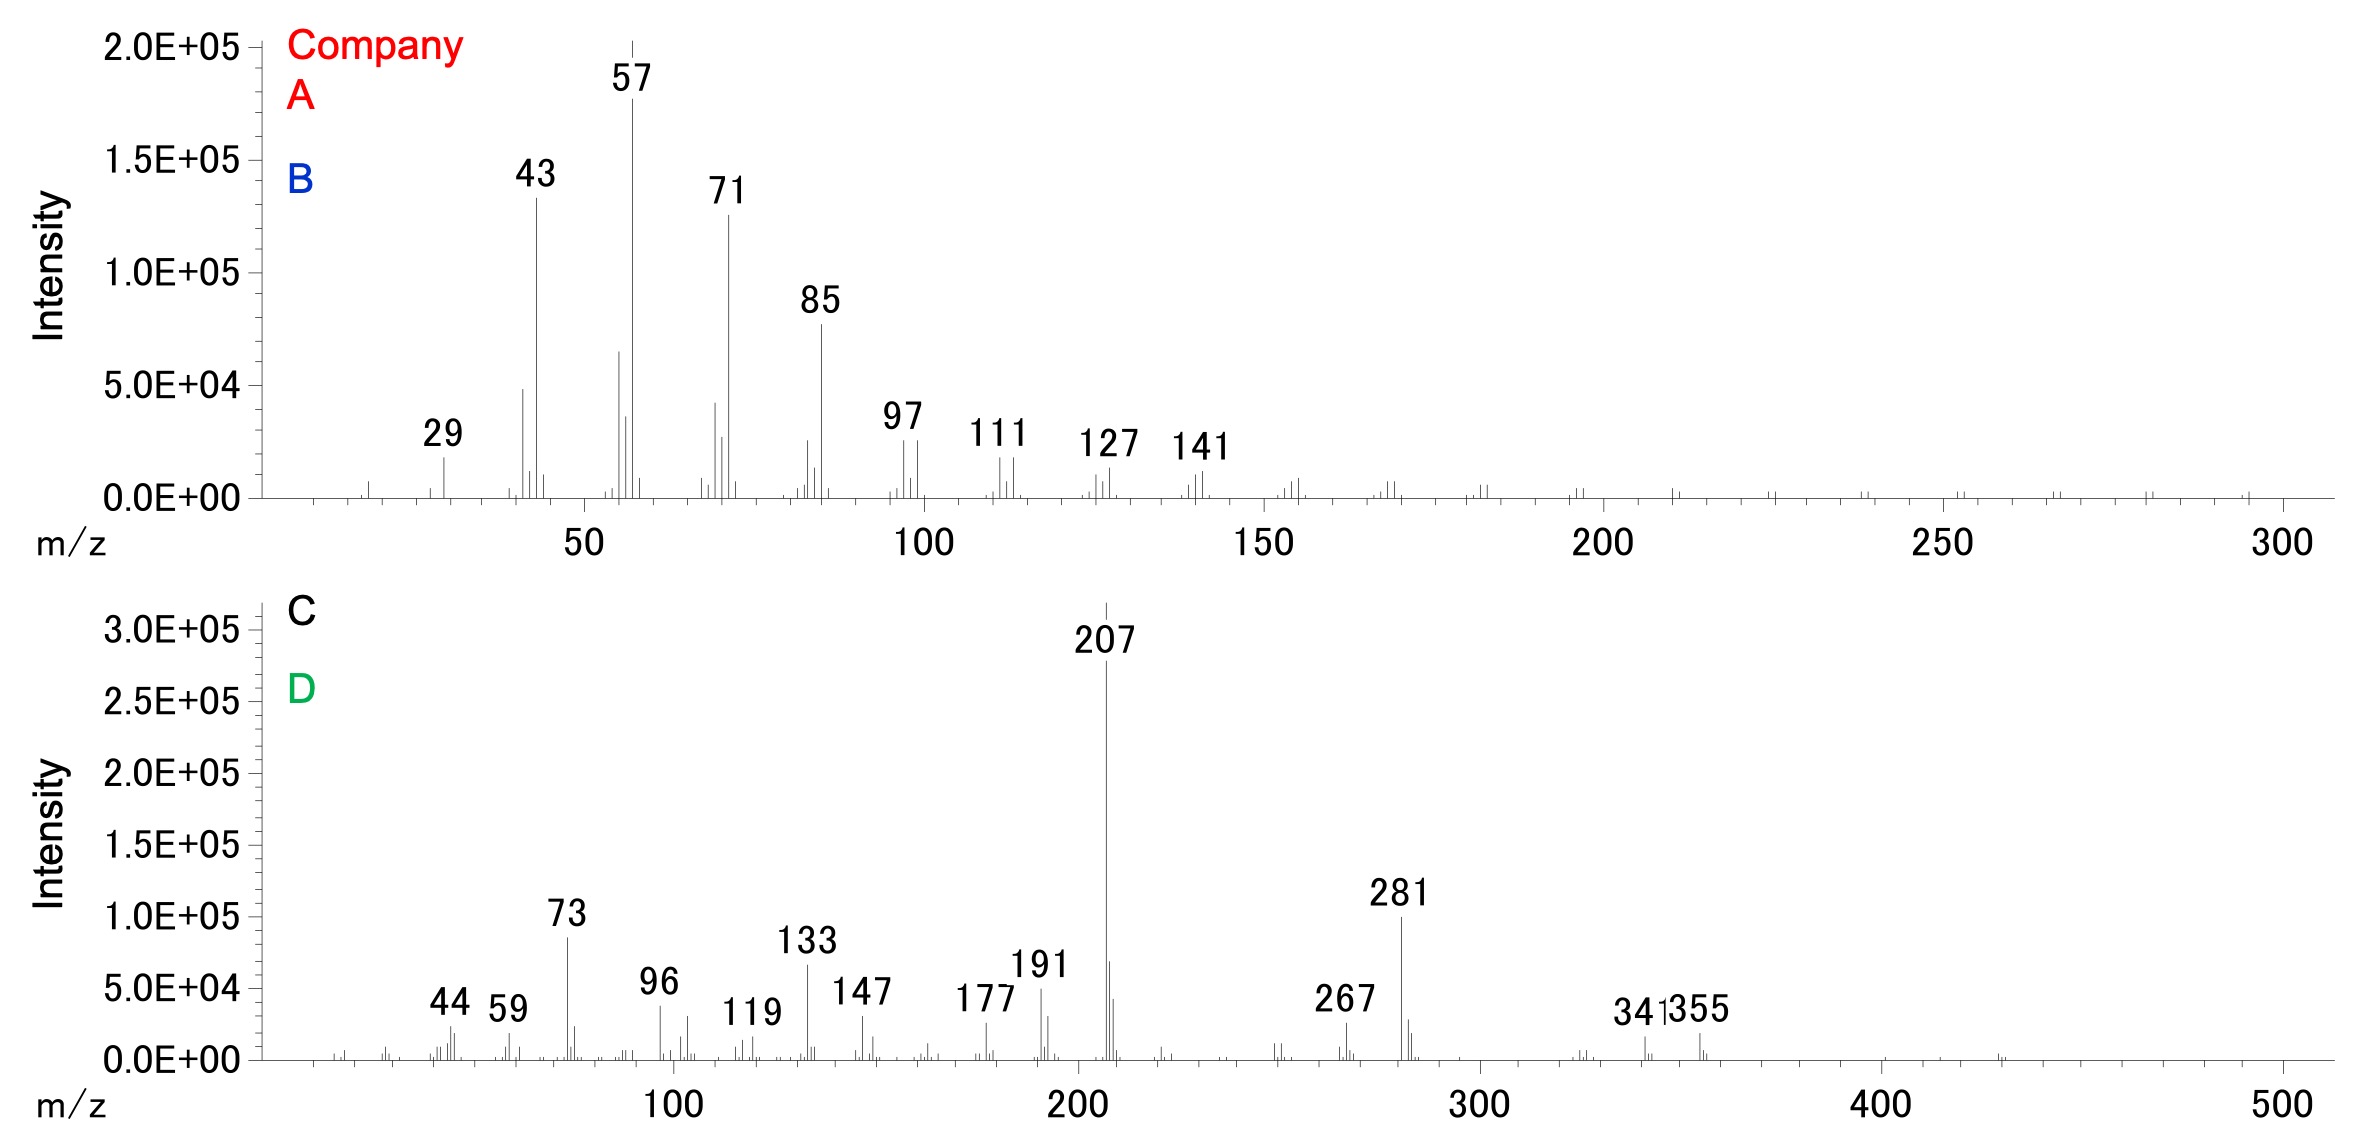
Figure 9. Mass spectra.
Conclusion
Several mechanical pencil leads were analyzed via TG-MS, and it was possible to compare the thermal performances from the results. TG-MS was also able to find differences in each manufacturer’s samples based on differences in raw materials and/or manufacturing processes. Consequently, TG-MS techniques are useful for understanding material details and for maintaining quality control.
Solutions by field
Related products
Are you a medical professional or personnel engaged in medical care?
No
Please be reminded that these pages are not intended to provide the general public with information about the products.