Delta Tips: Deconvolution Function
NMDT_0059
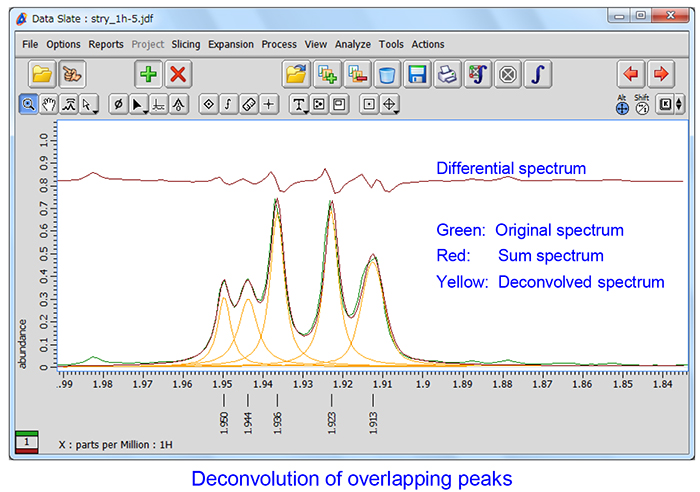
In Delta software, it is possible to deconvolve overlapping peaks with Lorentzian, Gaussian and a combination of Lorentzian and Gaussian functions.
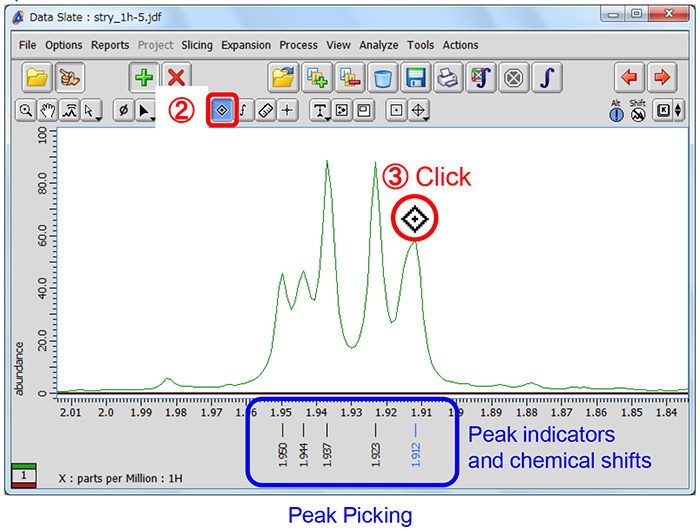
① Display a spectrum in the 1D Processor or Data Slate window.
② Click the Peak button to activate the peak picking mode.
③ Pick peaks in the spectrum with the cursor indicated by the Peak symbol.
Peak indicators (marks) and chemical shifts of the selected peaks have been displayed below the spectrum.
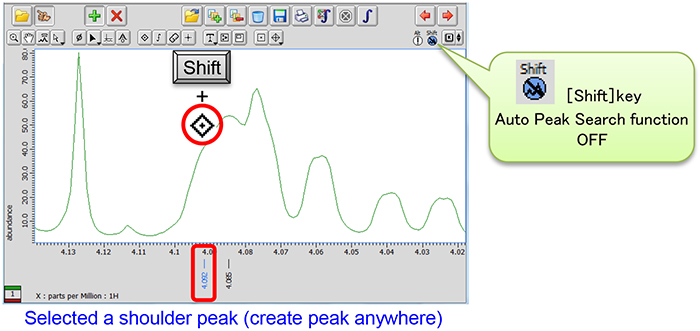
★ If you need to pick up some shoulder or broad overlapping peaks manually, push and hold the Shift key and create the peak.
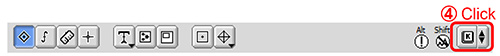
④ Push and hold the K menu button to display the pull-down menu.
⑤ Select a curve fitting function for deconvolution from the menu.
Deconvolution has been executed and the fitting result has been shown on the data.
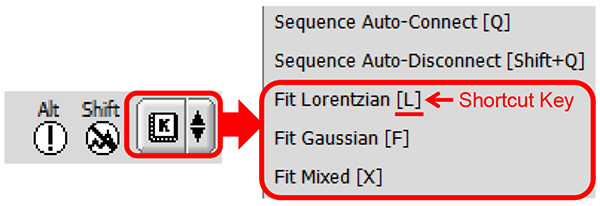
★ Fit Mixed is the Voigt fitting function which is a combination of Lorentzian and Gaussian functions.
★ The shortcut key is shown for each fitting function on the right.
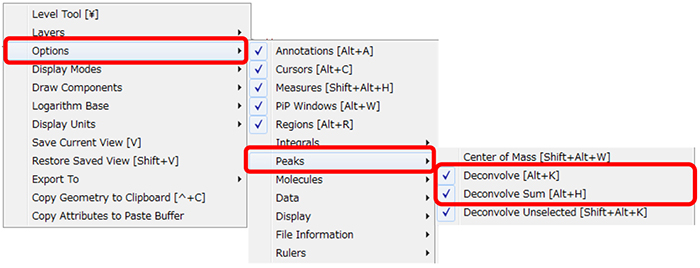
★ It is possible to display or hide the deconvolution result from the context menu as follows:
Push and hold the right mouse button to display the menu. Then select Options – Peaks – Deconvolve and Deconvolve Sum as shown below.
⑥ Select Analyze-Peak Spreadsheet to open the Spread Sheet window.
The detailed results for all deconvolved peaks have been summarized in the Spread Sheet table.
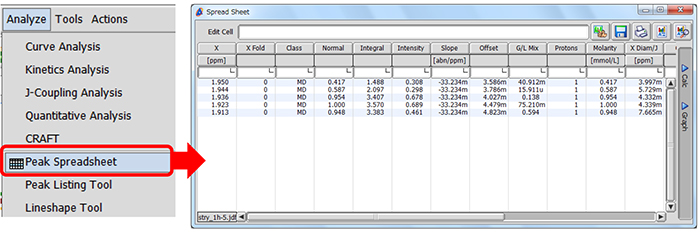
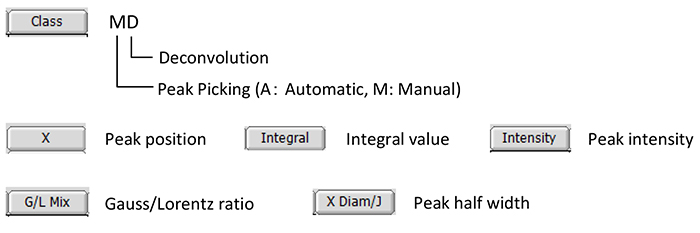
★ The Spread Sheet table
★ The result of deconvolution
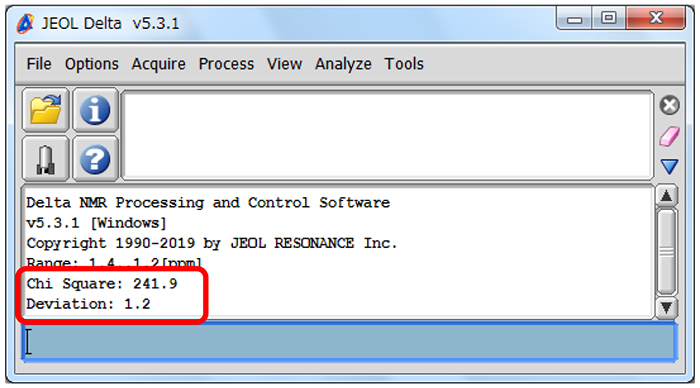
The Chi square value and the standard deviation value are shown in the Delta Console window.
★ Recalculation
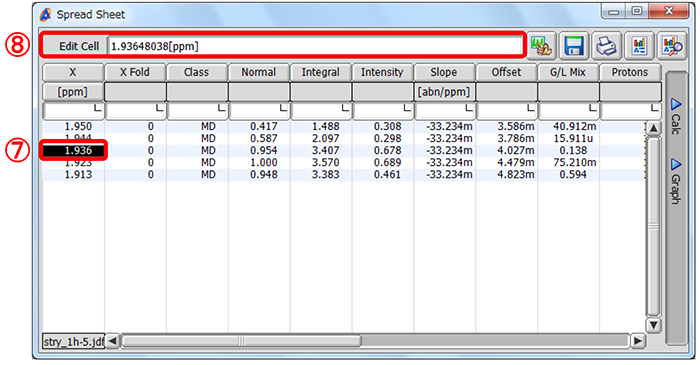
It is possible to set and fix the value of X (peak position), Intensity (peak intensity) and X Diam/J (peak half width) in a deconvolution result in the Spread Sheet window and execute deconvolution again.
⑦ Select a cell in the Spread Sheet window.
⑧ Input a value into the Edit Cell box.
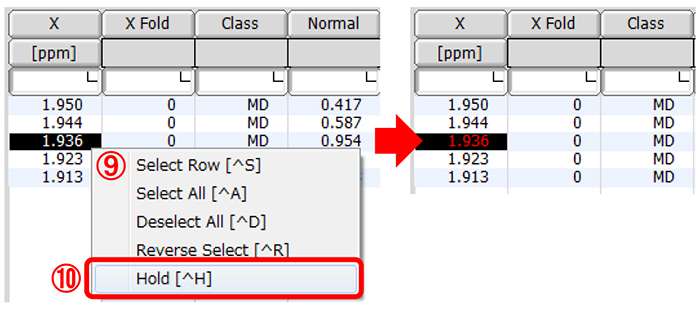
⑨ Push and hold the right-mouse-button over the cell to display the context menu.
⑩ Select Hold from the menu. The chemical shift value in the cell has turned red.
⑪ Select a curve fitting function from the K menu.
The recalculated result has been shown on the data.
- Please see the PDF file for the additional information.
Another window opens when you click. 
PDF 681.7 KB
Related Products
Are you a medical professional or personnel engaged in medical care?
No
Please be reminded that these pages are not intended to provide the general public with information about the products.