Delta Tips: Data Slate (Part 9)
NMDT_0046
How to use View Control Tool to accurately adjust display range
It is possible to accurately control the display range of the spectrum displayed in Data Slate by using the View Control Tool. This tool allows us to input X and Y range limits numerically.
① Select Tools – Geometry Tools – View Control to open the View Control window.
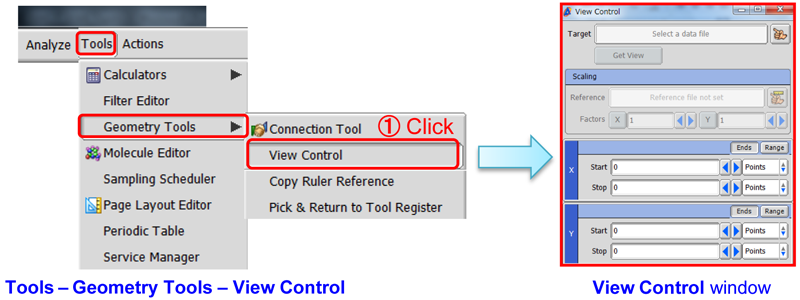
② Push the Finger button to activate the selection function in the View Control window. Note that the cursor has changed into the Finger symbol.
③ Click inside the spectrum in the Data slate window to select it. Note that the content of the View Control window has been updated. The left and right chemical shift limits Start and Stop are shown in ppm (X-axis), while the minimum and maximum intensity limits Start and Stop in abn unit (Y-axis).

④ Input values into the Start and Stop input boxes in the View Control window. In the example below, we have set the display range to 3.0-1.5 ppm in X and 0-2 abn in Y. Note that View Control may adjust the limits to match actual data points.
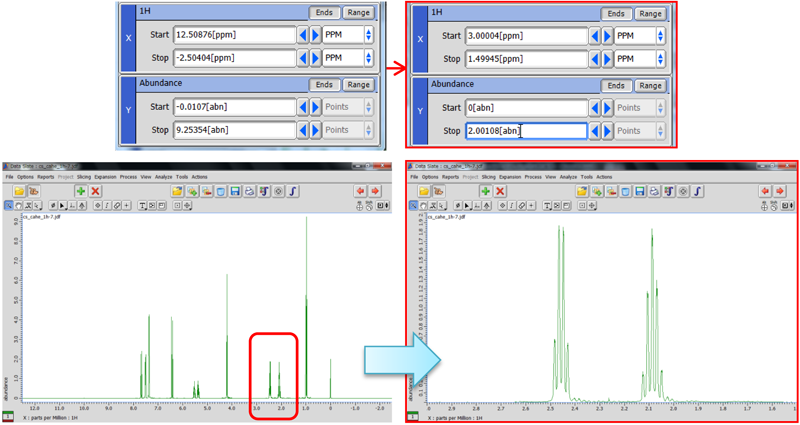
X range: 3.0-1.5 ppm
Y range: 0-2 abn
Y range: 0-2 abn
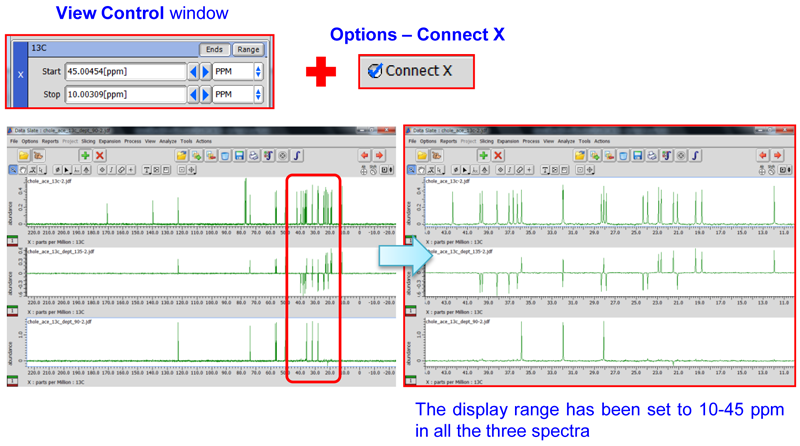
※ If the procedure described above is applied to a Data Slate window displaying multiple spectra while the Connect X function is on (refer to NMDT_0040 ), you can quickly adjust the display range of all the spectra at once.
- Please see the PDF file for the additional information.
Another window opens when you click. 
PDF 940 KB
SEARCH APPLICATIONS
Related Products
Are you a medical professional or personnel engaged in medical care?
No
Please be reminded that these pages are not intended to provide the general public with information about the products.