Delta Tips: Curve Analysis Tool
NMDT_0018
How to plot relaxation or diffusion data of multiple peaks at once
The procedure is demonstrated on T1 relaxation data.
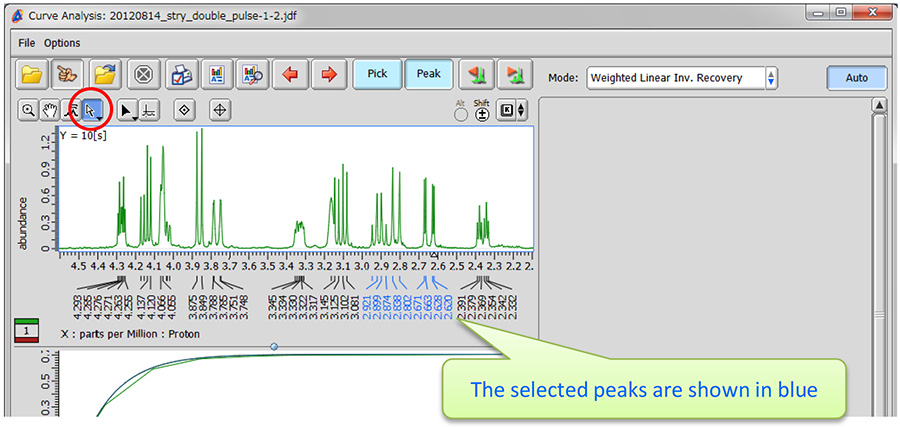
① Click the button in the red circle to activate the selection mode. Select the peaks of interest to plot their relaxation data.
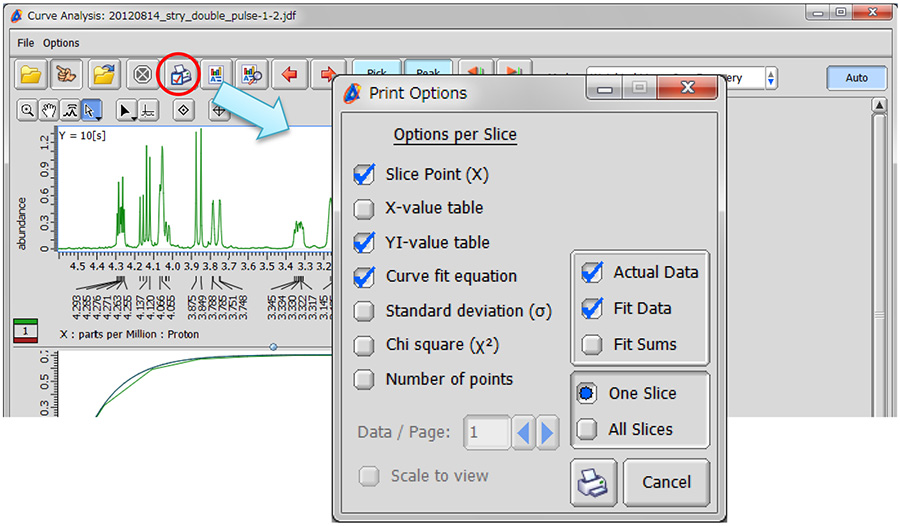
② Click the button in the red circle to plot the data. The Print Options window opens.
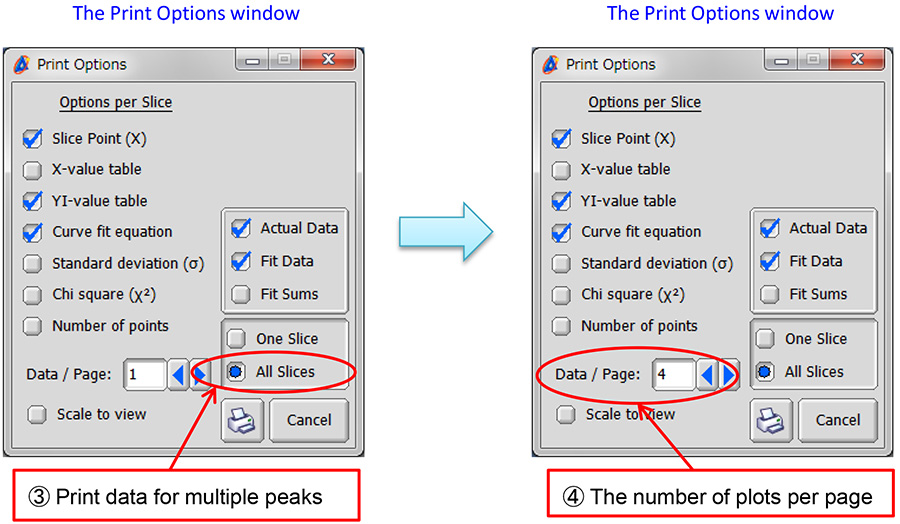
③ Select the ‘All Slices’ option in the Print Options window.
④ It is possible to print up to four plots per page. We will plot four plots per page.
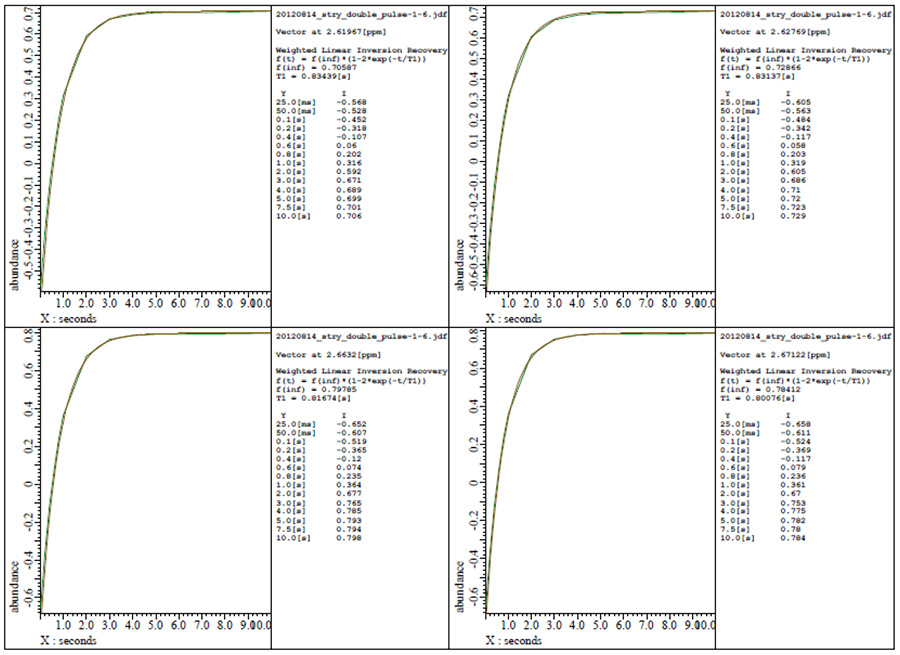
⑤ Click the printer button in the Print Options window to plot the data. In the Print window (not shown), select a printer to plot on paper or JEOL PDF to print to a PDF file.
⑥ An example of plot is shown below.
- If you want to see a printed version,
please click this PDF file. 
PDF 549KB
SEARCH APPLICATIONS
Related Products
Are you a medical professional or personnel engaged in medical care?
No
Please be reminded that these pages are not intended to provide the general public with information about the products.