Delta Tips: How to Report Multiple Relaxation Time Values
NMDT_0016
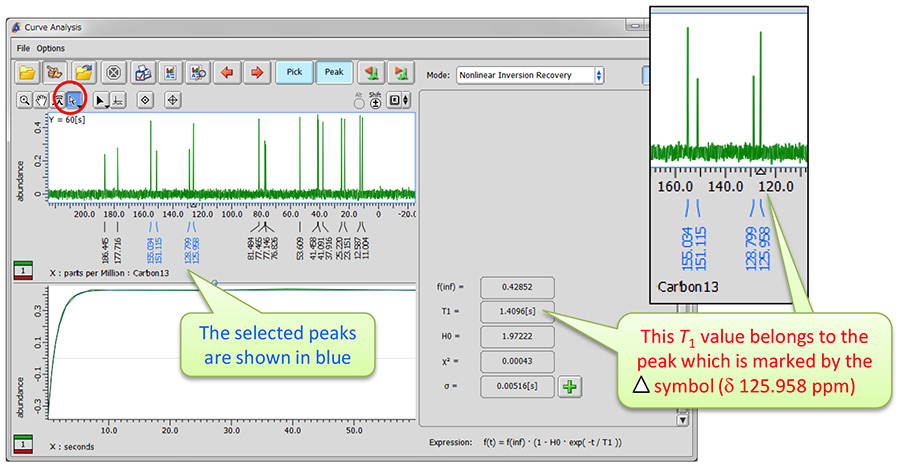
This issue of Delta Tips demonstrates how to report spin-lattice relation time (T1) values of multiple peaks at once.
① Click the button in the red circle to activate the selection mode in the Curve Analysis window. Select the peaks of interest to calculate and report their T1 values. We have selected four signals.
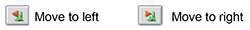
∗ If a group of peaks is selected, it is possible to switch from one peak to another one within the group by clicking the buttons shown below.
② Click the button in the red circle in the Curve Analysis window to create a report. The Report Options window opens.
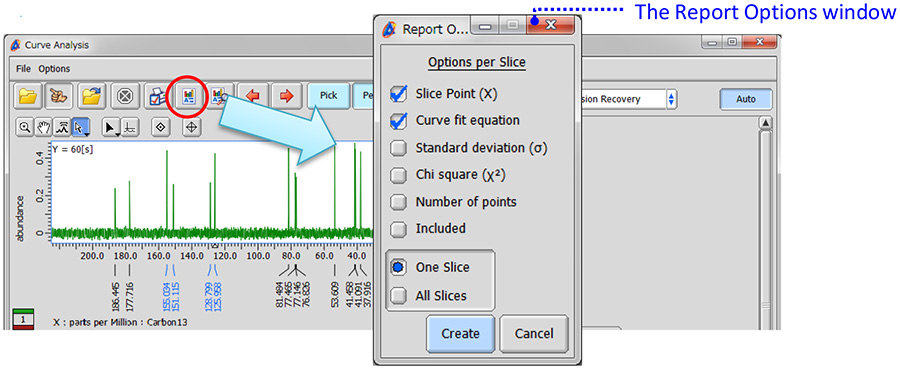
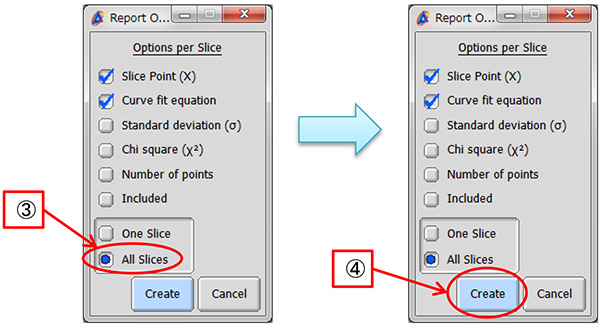
③ Select the ‘All Slices’ option in the Report Options window. The other check boxes allow you to customize content of report.
④ Click the [Create] button to create the report on all the peaks selected above.
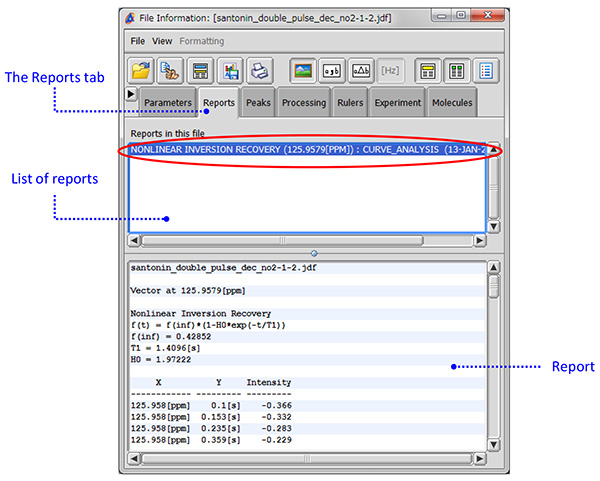
⑤ Click the button in the red circle to view the report. The File Information tool opens and the Reports tab is automatically displayed.
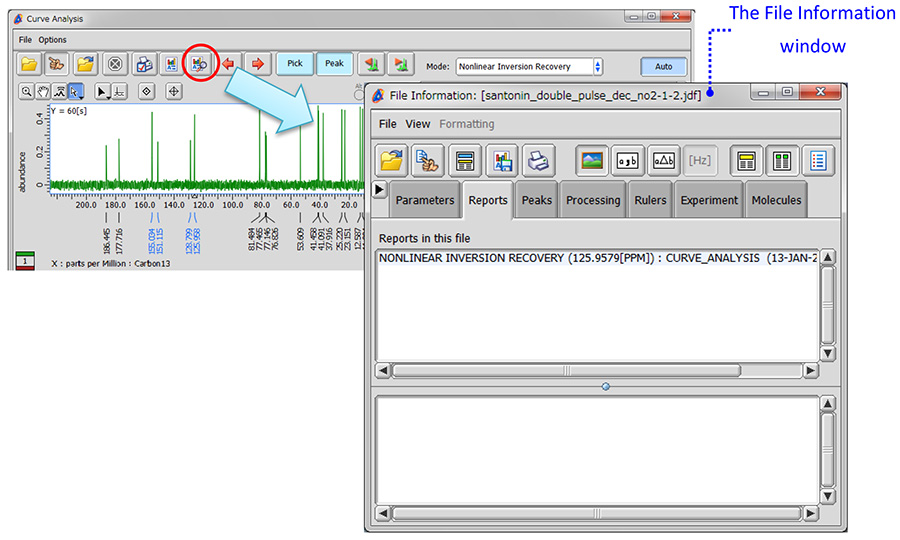
⑥ Select ‘CURVE_ANALYSIS’ to display the report.
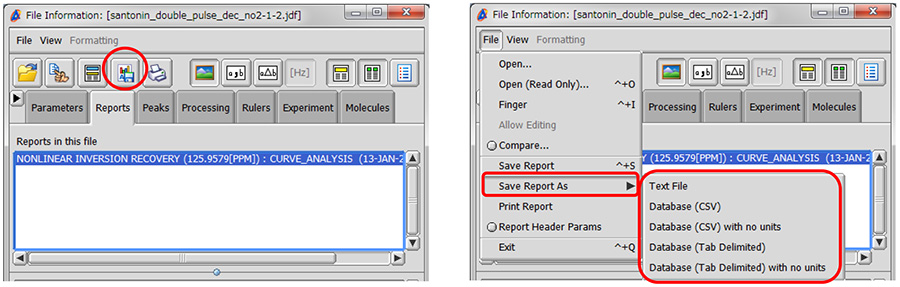
⑦ Save the report in a file as shown below.
∗ Click the button in the red circle to save the report on relaxation data as a text file (∗.txt).
∗ Select File – Save Report As to save the report as a text file (∗.txt), comma separated value file (∗.csv) or tab separated value file (∗.txt).
- If you want to see a printed version,
please click this PDF file. 
PDF 794KB
SEARCH APPLICATIONS
Related Products
Are you a medical professional or personnel engaged in medical care?
No
Please be reminded that these pages are not intended to provide the general public with information about the products.