Separation of 13C spectra of polyurethane soft and hard segments by ROSY
NM200013E
The ROSY (Relaxation Ordered SpectroscopY) is a method in which the 13C CPMAS spectrum of a mixture is classified by a longitudinal relaxation time of 1H, and the 13C CPMAS spectrum is displayed separately for each substance. In solution NMR, each peak in the 1H spectrum has its own longitudinal relaxation time. In solid-state NMR, however, spin diffusion occurs due to the dipolor interaction between 1H, and all 1H have the same longitudinal relaxation in the domain within a certain distance. The 13C spectrum can be separated for each domain by using this difference in relaxation time of 1H. The longitudinal relaxation time (T1H) obtained by the saturation recovery method as shown in Fig.1a is usually used to separate the 13C spectrum of the mixture. The size of the domain that can be separated by this method is about 100 nm. To separate domains smaller than this, a measurement using the relaxation time at rotational flame (T1ρH) obtained by the spinlock method as shown in Fig.1b is effective. The domain size that can be separated by T1ρH is about several nm, and it is possible to determine the phase separation structure of block copolymers and the molecular compatibility.
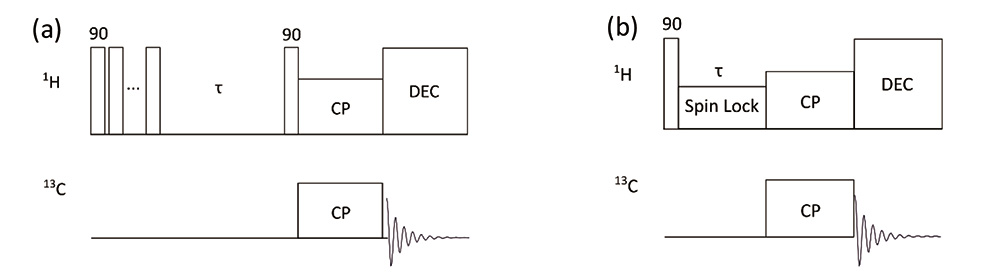
Fig.1 Pulse sequence diagrams of saturation recovery (T1H) based ROSY(a) and spinlock (T1ρH) based ROSY(b).
T1ρH based ROSY – Separation of soft segment and hard segments of polyurethane –
As a measurement example of the T1ρH based ROSY, we will introduce the separation of soft and hard segments of the 13C spectrum of polyurethane (a smart phone cover case). Polyurethane has soft and hard segments in the molecule, each of which aggregates between the molecules to form their respective domains. A typical method for distinguishing between soft and hard segments is measuring CPMAS which tends to observe hard segments, and the LD (Low power Decoupling) MAS which tends to observe soft segments (Fig.2). Although it is possible to see the difference in segments to some extent in the both measurements, it is often difficult to assign domains because CPMAS observes soft segments as well as hard segments, and LDMAS observes hard segments as well as soft segments in small increments. On the other hand, the ROSY separates the spectrum from spatial differences through 1H spin diffusion, allowing the two segments to be separated more clearly. Fig.3 shows the T1ρH based ROSY spectrum. In the T1H-ROSY spectrum, both segments cannot be separated (not shown). On the other hand, in the T1ρH-ROSY spectrum, the soft segment and the hard segment can be clearly separated. In addition, this indicates that the domain size of the segment ranges from a few nm to a few tens of nm.
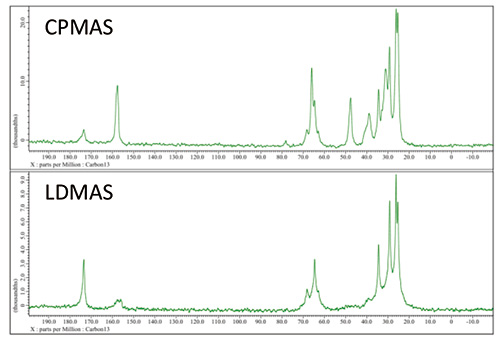
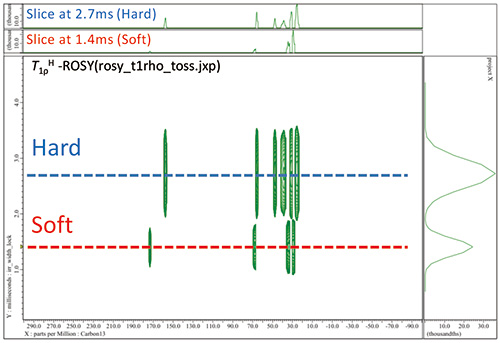
Fig.3 A T1ρH -ROSY spectrum of poly urethane.
- Please see the PDF file for the additional information.
Another window opens when you click. 
PDF 399.5KB
SEARCH APPLICATIONS
Related Products
Are you a medical professional or personnel engaged in medical care?
No
Please be reminded that these pages are not intended to provide the general public with information about the products.