Experimental set-up of high-resolution 1H solid-state NMR by wPMLG
NM200010E
1H, in principle, is very useful nucleus to investigate atomic-resolution structures and dynamics due to its high abundance (>99%) and gyromagnetic ratio (600 MHz at 14.1T). In fact 1H is the first choice of nucleus in solution NMR. On the other hand, 1H NMR of rigid solids is much less common. This is because 1H solid-state NMR gives very broad (~50 kHz) and featureless spectra (Fig 1a) due to strong 1H-1H dipolar coupling, which is dynamically averaged out in solution. Magic angle spinning (MAS) removes the broadening to the first order, but is not enough to achieve high resolution 1H NMR at moderate MAS rate (Fig 1b). Tremendous efforts were made to overcome this issue from the early dates of solid-state NMR towards high-resolution 1H NMR [1]. Most of them combine MAS with sophisticated 1H pulses which is dubbed CRAMPS (combined rotation and multiple pulse spectroscopy). Nowadays very fast MAS > 60 kHz can be used to achieve high-resolution 1H solid-state NMR (Fig 1c) [2]. However, the traditional CRAMPS is still useful as that can be performed with very conventional solid-state NMR equipment, for example 4 mm MAS probe with a 400 MHz spectrometer. Moreover, wPMLG at moderate MAS rate often overwhelms fast MAS in terms of resolution. In this note, we will describe tutorial guidance to optimize experimental parameters for CRAMPS. Especially, we focus on wPMLG (windowed phase modulated Lee-Goldburg) which is one of the most widely used CRAMPS method (Fig 1d) [3].
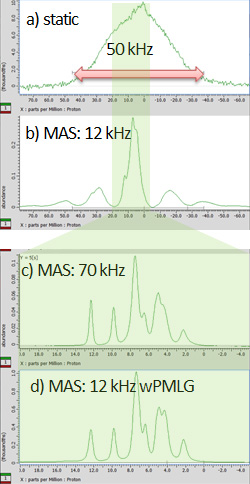
Fig 1
Solid-state NMR spectra of L-tyrosine.HCl at a) the static condition, b) 12 kHz MAS, c) 70 kHz MAS, and d) 12 kHz MAS with wPMLG acquisition. While a-c are observed by 1H single pulse experiments, d) is observed under wMPLG 1H-1H decoupling. The spectra were observed by JNM-ECZ600R spectrometer at 14.1 T static magnetic field with 2 mm HXMAS (a, b, d) and 1 mm HXMAS (c) probes. Samples were packed into the full volume of rotors without any spacers.
The wPMLG scheme is shown in Fig 2. It consists of bundles of (typically 3-5) pulses with linear phase ramp. This mimics the frequency shift, resulting in Lee-Goldburg irradiation for 1H-1H decoupling. The PMLG scheme can be applied in windowless manner in the indirect dimension, however, windowed PMLG is recommended so that direct 1H observation is applicable. 180 degree phase shift is applied to every other wPMLG block so that the magnetization evolves along the z axis as same as regular time evolution [4]. This removes a part of artifact and allows easy implementation of wPMLG to the other complicated sequences.
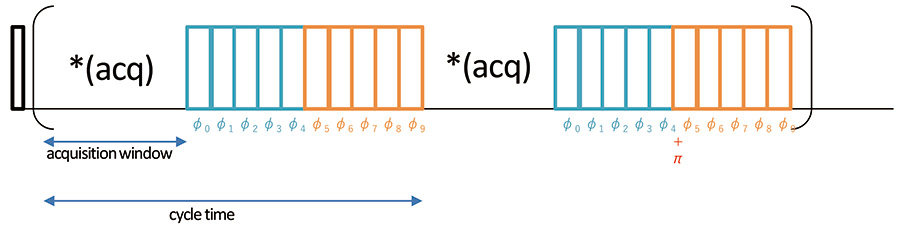
Fig 2
Pulse schemes of wPMLG 1H high-resolution method. The magnetization is excited by the initial 90 degree pulse and evolves under following wMPLG irradiation. NMR signal is sampled at every acquisition windos. φk= φlast(k+0.5)/5 for k=0-4 and π+φlast(9.5-k)/5 for k=0-4. φlast is typically set to 208 degree due to historical reason, but can be changed, giving additional resolution.[5, 6]
The key to successful wPMLG observation is experimental optimization of conditions. The wPMLG sequence has various parameters which should be experimentally optimized, namely, cycle time, 1H offset, length of acquisition window etc. The best condition depends on probe, MAS rate, sample etc. and needs to be optimized sample to sample. But it was tedious and time-consuming procedure. Here we briefly introduce the optimization procedure which is proposed by Pruski et al. [7] Following this procedure, one can easily find optimal condition in a systematic way. In this approach, experimental conditions were optimized to maximize the residual magnetization after spin echo under PMLG irradiation (sequence shown in Fig 3). This approach essentially maximizes T2’. As T2’ in solids are dominated by 1H-1H interactions, the maximum T2’ results in minimum residual 1H-1H interactions, resulting in high resolution 1H NMR spectra.
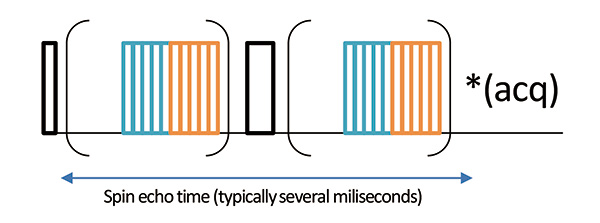
Fig 3
Spin echo sequence with wPMLG irradiation during echo evolution. Note that the 1H signal is observed without wPMLG irradiation. Thus the 1H resolution doesn’t change parameters to parameter. Instead of resolution, one can find the condition which maximizes the signal intensity.
Experimental demonstration
As the optimal parameter depends on sample, we recommend to optimize parameters on your sample rather than standard sample. The crucial parameters for wPMLG are cycle time, offset and MAS rate. At an certain MAS rate, first one can optimize cycle time. Offset can be 5 ppm (or whatever) for the first attempt. The rf field can be 120-160 kHz [6]. In most moderate MAS prove, one can use 100%. Fig 4 shows a set of spin echo spectra with varying cycle time from 10 to 50 us every 1 us.
Criterion: maximize the signal intensity
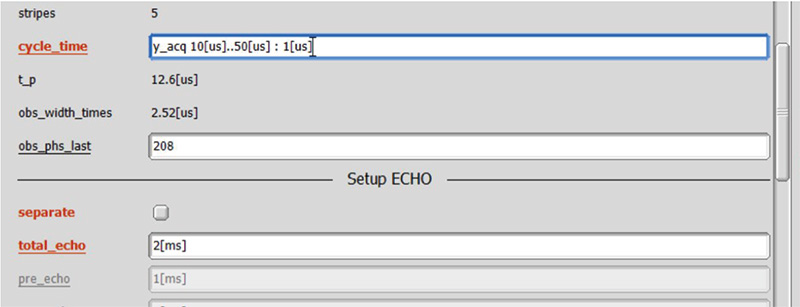
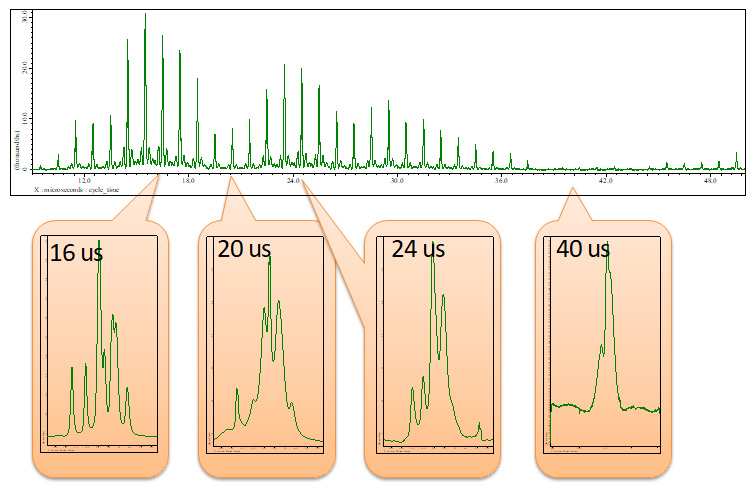
Fig 4
A set of 1H spin echo spectra with wPMLG decoupling during echo time (see Fig 3) of L-tyrosine.HCl under 12 kHz MAS at 14.1 T.
The cycle time (defined in Fig 2) is varied from 10 to 50 us every 1 us. Total spin echo duration is set to 2 ms. Inset shows representative wPMLG spectra obtained at each cycle time.
As shown Fig 4, the spin echo intensity varies depending of cycle_time. The maximum signal intensity appears at cycle_time = 16 us. The wPMLG spectra are also shown in Fig 4. This clearly shows the direct relationship between the spin echo signal intensity and wPMLG resolution. For example, very broad 1H wPMLG spectrum was observed with cycle time = 40 us where spin echo intensity is null. Somehow high resolution spectrum was observed at cycle time = 24 us which is second local maxima, but the resolution is inferior to that at cycle_time = 16 us which is global maxima.
Next 1H offset is optimized. One can use spin echo approach again or can optimize parameters by directly monitoring 1H wPMLG spectra. Either is fine, but the latter may be better as one can also monitor the artifact as well. In windowed acquisition experiments, artifacts which are coming from modulations with different cycle times inevitably appear. These artifacts has to be located outside the spectral area or at least overlap to peaks of interest should be avoided. Fig 5 shows the experimental optimization of 1H offset using wPMLG spectra. The cycle time is set to the optimal value which is obtained in the previous step (in this case 16 us, see Fig 4). X_offset is varied from -15 to 15 ppm every 1 ppm. The best resolution appears around 10 ppm.
The optimization of cycle_time and x_offset can be iteratively repeated until convergence. Note that x_acq_time has to be shorter than 50 ms to avoid prove failure as 1H rf is almost continuously irradiated during acquisition. X_acq_time depend on not only x_points but also cycle_time.
Pulse program: wpmlg5.jxp
Criterion: maximize the resolution, avoid artifacts overlapping to peaks.
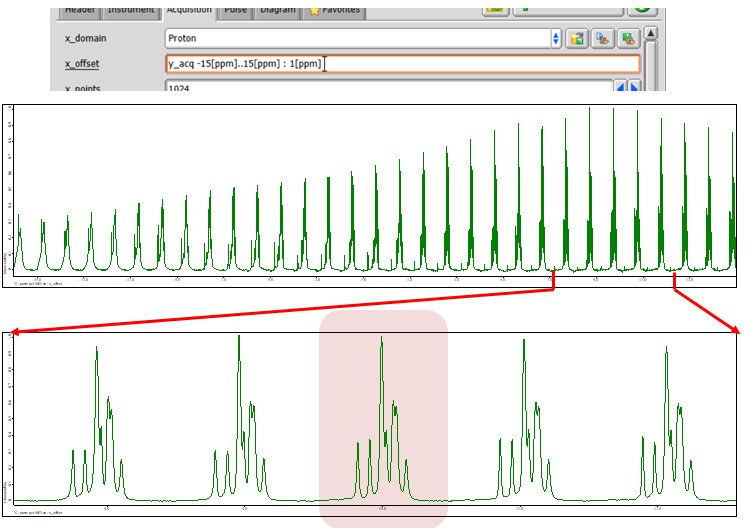
Fig 5
A set of 1H wPMLG spectra of L-tyrosine.HCl under 12 kHz MAS at 14.1 T. The 1H offset is varied from -15 to 15 ppm every 1 ppm.
As mentioned before, x_offset can also be optimized by maximizing the spin echo signal intensity (Fig 6). The maximum appears at x_offset = 10 ppm, which is in good agreement with that of wPMLG observation. However, spin echo doesn’t tell where artifacts appear in the spectra, thus the final optimization has to be done by directly monitoring wPMLG spectra.
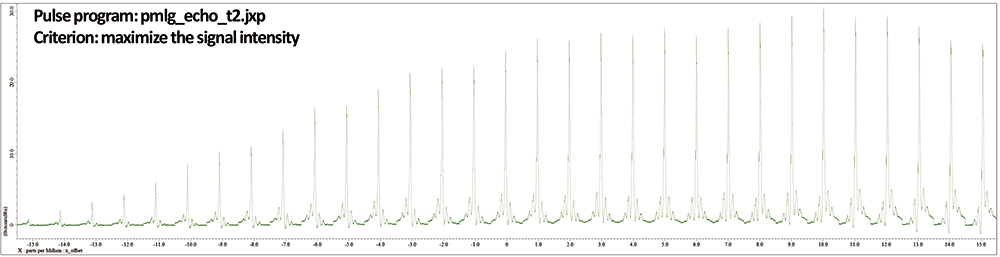
Fig 6
A set of 1H spin echo (wPMLG) spectra of L-tyrosine.HCl under 12 kHz MAS at 14.1 T. The 1H offset is varied from -15 to 15 ppm every 1 ppm.
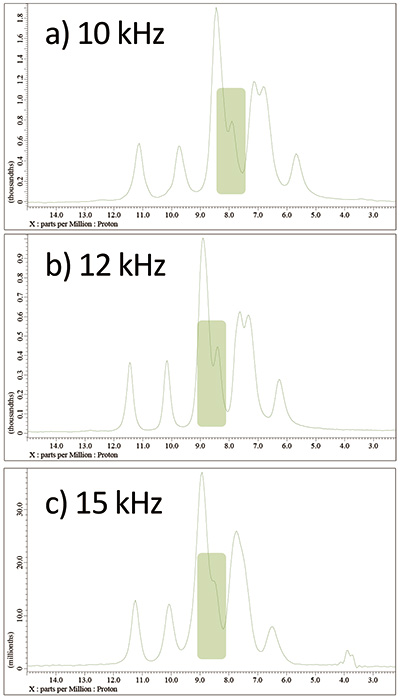
Fig 7
wPMLG spectra of L-tyrosine.HCl at 14.1 T under a) 10 kHz, b) 12 kHz, and c) 15 kHz MAS. The spectra were shown after optimization at each MAS rate.
It should be noted that the best achievable resolution depends on MAS rates. Faster MAS not necessarily gives higher resolution. In fact, 12 kHz MAS gives the best resolution among 10 kHz, 12 kHz and 15 kHz after optimization (Fig 7). We recommend to optimize conditions at several different MAS rate to achieve highest resolution. This also helps to avoid misassignment of artifacts. For example, the splitting marked with green in Fig 7 could be artifact. However, as it appears for all the conditions and MAS rate, we can safely conclude that it is real splittings. Further linenarrowing may be obtained by fine tuning of acquisition window, rf field strength, φlast [5, 6] etc. As wPMLG is sensitive to rf field inhomogeneity [8], limiting the sample volume with spacers may help to improve resolution.
How can we distinguish artifacts from real signal? One way is as mentioned above, one can compare spectra optimized at different MAS rate. Alternatively or additionally, one can assign artifacts by carefully comparing the spectra observed with different parameters at the same MAS rate. The artifact moves systematically depending on the variation of parameters. As shown Fig 8, one can easily assign where the artifacts appear. The figure also indicates that the position of artifacts are quite sensitive to experimental parameters. One can move the artifact away from the peaks of interest by slightly changing experimental parameters (x_offset, cycle_time etc.) without significantly sacrificing resolution.
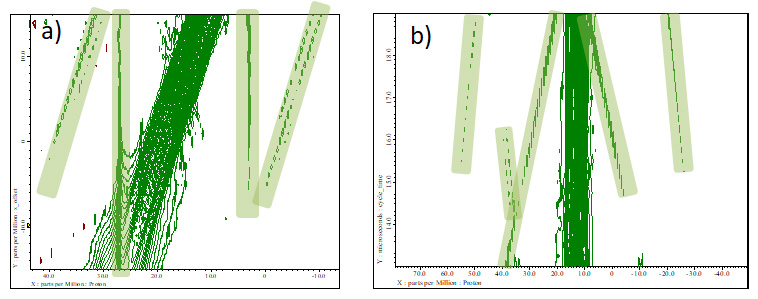
Fig 8
A set of wPMLG spectra of L-tyrosine.HCl under 12 kHz MAS at 14.1 T with varying a) offsets and b) cycle time. Artifacts are marked with green.
Data processing
As shown above, one can observe high-resolution 1H NMR spectra using wPMLG. However, the ppm scale in the final data has to be corrected with scaling factor. This is because, wPMLG scales down the ppm scale, or in other words, wPML spectra are shrunken horizontally. This required additional procedure in processing. The procedure includes two steps; 1) rescaling of ppm scale and 2) correcting referencing. The first part needs two separated peaks with known chemical shifts. Unfortunately, the chemical shifts are typically unknown, hampering this process. Instead, one can observe the standard sample with the identical experimental conditions. Offset may be optimized for standard samples, but the rest of the experimental parameter must be the same to keep the scaling factor identical.
As a demonstration, we use L-tyrosine.HCl. As a reference, we use the spectrum observed at 70 kHz. Instead, one may use values from literature. The separation between outermost peaks is 10.06 ppm (Fig 9). The separation in wPMLG is 5.19 ppm because of spectral scaling, giving scaling factor 5.19/10.06 = 0.516. This can be corrected by "linear_ref" (Display -> Reference -> Linear Reference) processing. One can put inverse of scaling factor in alpha. The processed data gives separation of 10.06 ppm. This procedure corrects the horizontal scaling, however, the reference needs to be corrected as well.
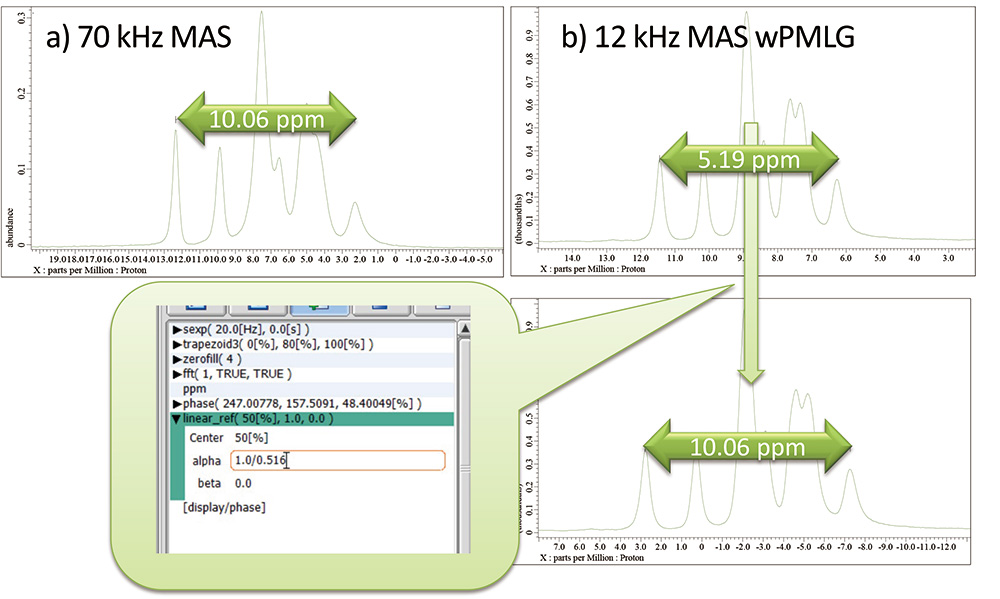
Fig 9
a) Spin echo at 70 kHz MAS and b) wPMLG at 12 kHz MAS spectra of L-tyrosine.HCl at 14.1 T. The separation of chemical shift is corrected by linear_ref function in the process list, resulting in correct peak separation.
The referencing can be done on the sample itself if there is distinct peak in MAS spectra. For example, peaks at 12.2 ppm of L-tyrosine.HCl is resolved even at 12 kHz MAS (Fig 1b). If not, one can repeat the experiments on the standard sample with the identical experimental conditions including offset for referencing. The final referencing can be done by "reference" (Display -> Reference -> Reference) processing. The left most peak appears at 2.76 ppm after linear_ref processing. Since this peak should appear at 12.2 ppm, one can add "reference" processing with "position" of 2.76 ppm where peak is appearing and "Reference" of 12.2 ppm where peak should appear. The comparison between 1H NMR at 70 kHz and wPMLG at 12 kHz is shown in Fig 10. As can be seen, wPMLG gives even better resolution than 1H single pulse at 70 kHz.
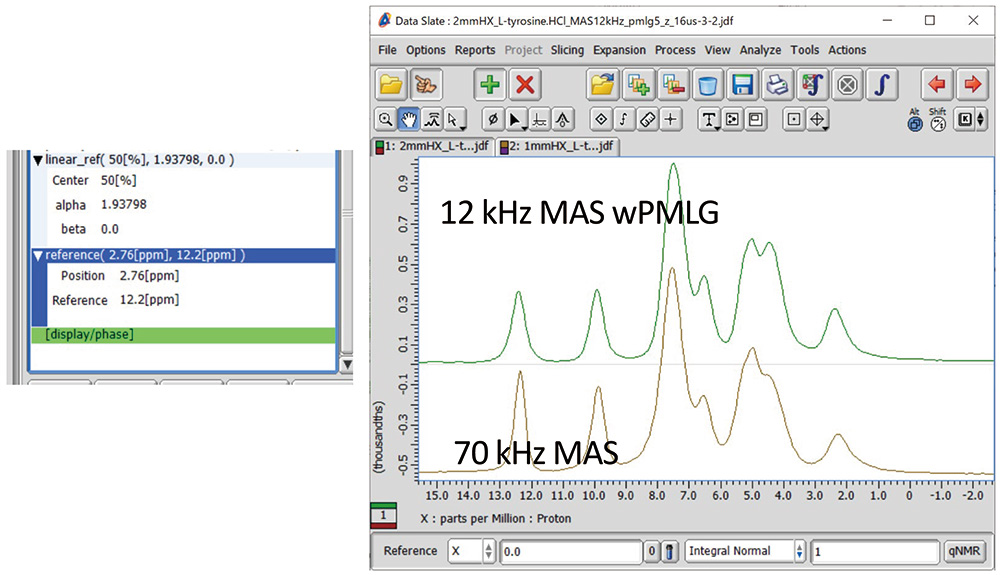
Fig 10
Reference processing (left) and 1D comparison of L-tyrosine.HCl between 1H single pulse at 70 kHz MAS (brown) and wPMLG at 12 kHz MAS (green).
References:
- [1] K.R. Mote, V. Agarwal, P.K. Madhu, Prog. Nucl. Magn. Reson. Spectrosc 97 (2016) 1-39.
- [2] Y. Nishiyama, Solid State Nucl. Magn. Reson. 78 (2016) 24-36.
- [3] E. Vinogradov, P.K. Madhu, S. Vega, Chem. Phys. Lett. 5-6 (1999) 443-450.
- [4] M. Leskes, P.K. Madhu, S. Vega, J. Chem. Phys. 128 (2008) 052309.
- [5] X. Lu, O. Lafon, J. Trebosc, A.S.L. Thankamony, Y. Nishiyama, Z. Gan, P.K. Madhu, J.-P. Amoureux, J. Magn. Reson. 223 (2012) 219-227.
- [6] Y. Nishiyama, X. Lu, J. Trebosc, O. Lafon, Z. Gan. P.K. Madhu, J.-P. Amoureux, J. Magn. Reson. 214 (2012) 151-158.
- [7] K. Mao, M. Pruski, J. Magn. Reson. 203 (2010) 144-149.
- [8] J. Hellwagner, L. Grunwald, M. Ochsner, D. Zindel, B.H. Meier, M. Ernst, Magn. Reson 1 (2020) 13-25. doi.org/10.5194/mr-1-13-2020
- Please see the PDF file for the additional information.
Another window opens when you click. 
PDF 1.84MB
SEARCH APPLICATIONS
Related Products
Solutions by field
Are you a medical professional or personnel engaged in medical care?
No
Please be reminded that these pages are not intended to provide the general public with information about the products.