Study of Chemical Exchange by 2D NMR
NM200003E
The NMR signal of a spin reflects its local magnetic environment. If a spin due to chemical exchange samples two magnetically different states then its NMR signal would reflect both states. Its appearance on a NMR spectrum would be determined by the dynamics of the exchange event. In the case of chemical exchange that is slow on the NMR time scale, it is possible to observe two distinct signals for the same spin, one signal for each state under exchange. Presence of chemical exchange is often demonstrated with the exchange experiment (2D NOESY experiment). A exchange peak (cross peak) of the same sign can be observed between the two autopeaks (diagonal peaks) that represent the two states under exchange. Because the same results can be interpreted in a different way based on NOE, further evidence is desirable.
ZZ exchange experiment is a 2D NMR experiment for the quantitative study of slow chemical exchange in proteins. It was originally reported as a 1H15N HSQC that uses as NMR probe the relatively isolated 1H15N spin system in the peptide bond of uniformly 15N labeled proteins. A 1H13C HSQC version of the above experiment was prepared and tested on a small compound.
ZZ exchange experiment
Because of the partial double bond character of the amide C-N bond in N,N dimethylformamide (DMF), free rotation around C-N is hindered and a slow exchange can be established between the two distinct methyl proton signals (states A and B). Cross peaks (exchange peaks) with the same phase with the diagonal peaks can be observed in 2D NOESY and 2D ROESY experiments (Fig.1).
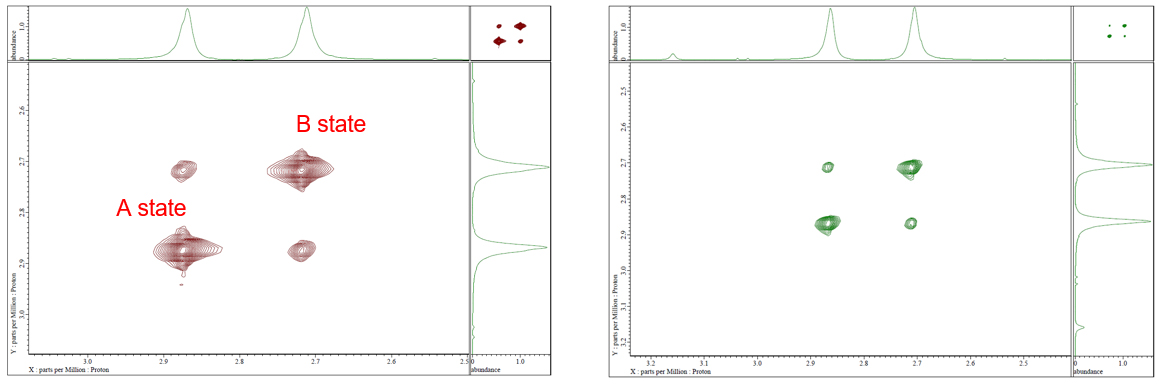
Fig 1: 2D NOESY (left) and 2D ROESY (right) of DMF in DMSO-d6 at 70°C.
This slow exchange system was further examined with the newly prepared ZZ exchange experiment. Briefly, in the 1H13C ZZ exchange experiment, following 13C frequency-labeling during t1 (indirect dimension), magnetization is changed into in phase 13C Z magnetization and is allowed to exchange. Then magnetization is transferred to proton and labeled with its proton frequency during FID (direct dimension) (Fig.2).
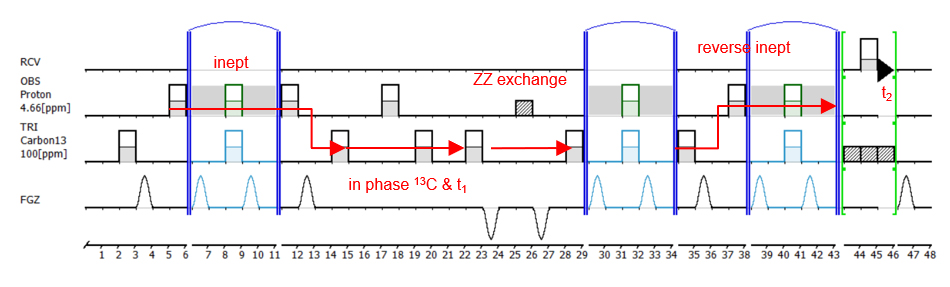
Fig 2: 1H13C ZZ exchange experiment.
The results with DMF are shown in Fig.3 for different values of mixing time. Exchange peaks were observed between the two 1H-13C cross peaks (auto peaks) representing the two exchanging states. Auto peaks represent magnetization that didn’t exchange during mixing time. Exchange peak denoted as B->A in Fig.3 represents B magnetization at the start of ZZ exchange (labeled with the B carbon frequency during t1) that was exchanged during mixing time and therefore it was transferred to A state (labeled with A proton frequency during t2). Similarly, the A->B exchange peak represents A state carbon magnetization that was transferred to B state and labeled with the B proton frequency.
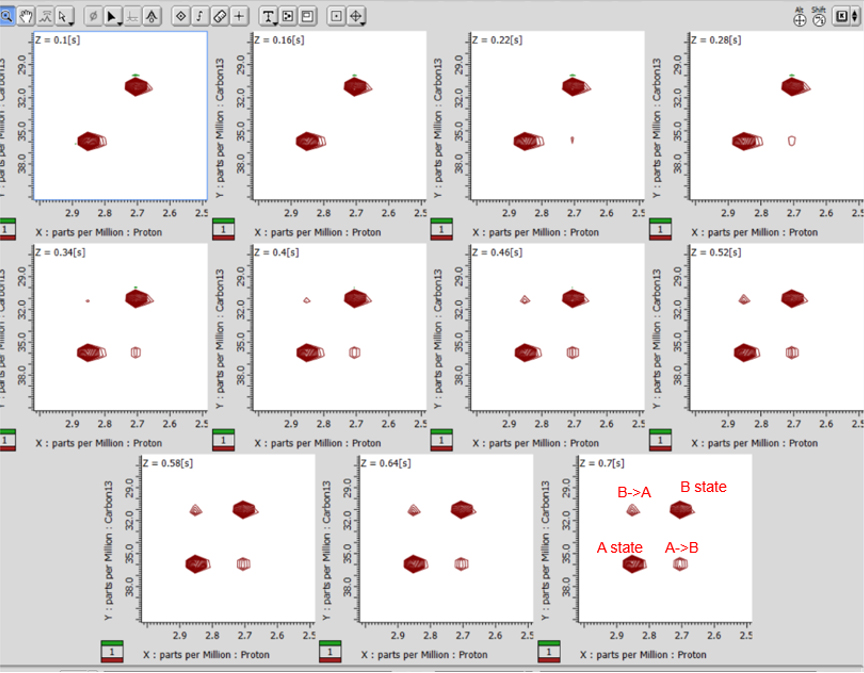
Fig 3: 1H13C ZZ exchange experiment for DMF in DMSO-d6. The 2D experiment was executed as array measurement for the acquisition parameter "mixing time". The result is a single pseudo-3D data file with the recorded values of mixing time on the Z-axis
Phase cycling combined with proton decoupling and in phase carbon magnetization during mixing time ensure that there is no NOE contribution to exchange peaks. Therefore, the above experiment can confirm the presence of slow exchange or even provide under favorable conditions, quantitative description of the exchange event.
It is necessary in the above experiment that the exchange states A and B show different chemical shifts for both proton and carbon. If this is not the case then the exchange peaks will overlap with the autopeaks. In the special case where exchange states show same proton but different carbon chemical shifts, exchange might be demonstrated with a 13C-13C NOESY type of experiment (Fig.4).
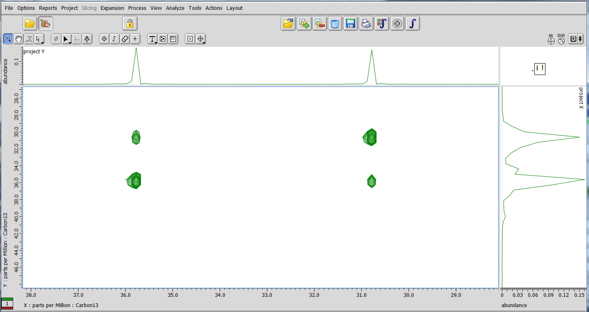
Fig 4: 13C-13C NOESY for DMF in DMSO-d6 at 70°C.
Reference
J Biomol NMR, 4, 727-734, 1994
console
JNM-ECZ400S, JNM-ECZ600R+ROYALPROBE™
- Please see the PDF file for the additional information.
Another window opens when you click. 
PDF 881KB
Related Products
Solutions by field
Are you a medical professional or personnel engaged in medical care?
No
Please be reminded that these pages are not intended to provide the general public with information about the products.