Application of 14N decoupled HETCOR for 19F-mediated amide hydrogen bonds with ROYALPROBE™ HFX
NM190011E
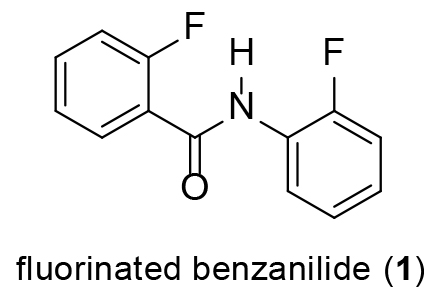
Fluorine and nitrogen containing organic compounds are often found in a variety of fields such as pharmaceutical and material sciences. Such compounds show unique properties based on their conformations and orientations, which are often induced by hydrogen bonds between N-H and F atoms. Therefore, analysis of molecular conformations and inter-molecular interactions are important. Here, we report 14N decoupled 1H–19F HETCOR as an example of hydrogen bonds analysis between N-H and F for fluorinated benzanilide (1) as a demonstration.

Measurements of 1H NMR with 14N decoupling
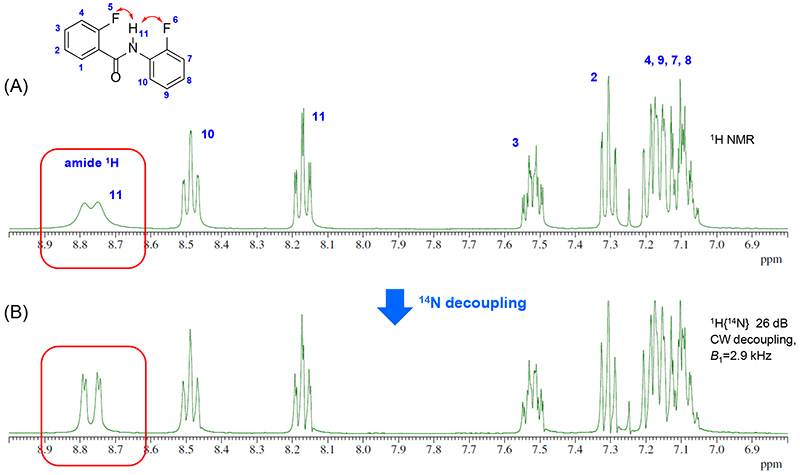
NMR spectroscopy is a powerful tool for analysis of hydrogen bonds, and its J coupling value provides the information of hydrogen bond. Fig.1(A) shows 1H NMR spectrum of 1. Amide 1H signal is observed in the lowest magnetic field region, ca 8.77 ppm. In this case, severe line broadening is arising from quadrupolar 14N. In contrast, measurement of 1H NMR under the 14N decoupling condition, resulted in the sharp amide 1H signal observation as double of a doublet (Fig.1(B)). This splitting signal is derived from bifurcated hydrogen bond bridges between N-H (11) and two F (F5, F6) atoms.

Fig.1 (A) 1H NMR spectrum of 1 (B) 1H{14N} NMR spectrum of 1
Sample: 36 mg fluorinated benzanilide in chloroform-d
Equipment: JNM-ECZ400S with ROYALPROBE™ HFX※
※Special modification for 14N nuclei required.
Measurements of 1H–19F HETCOR with 14N decoupling
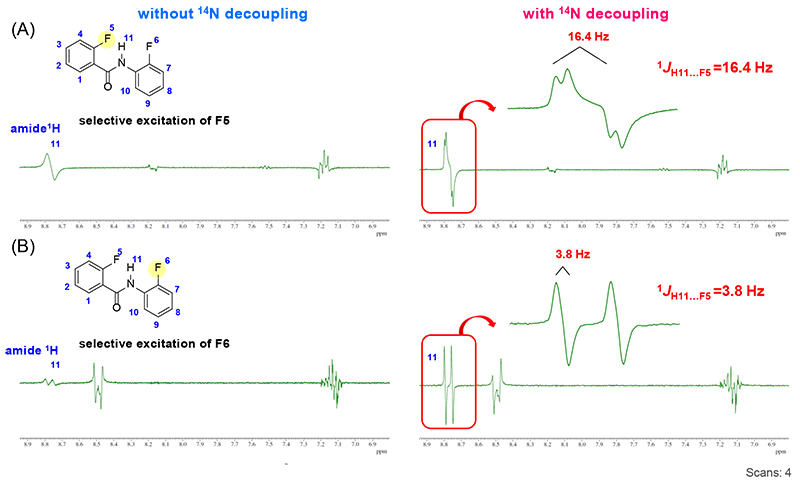
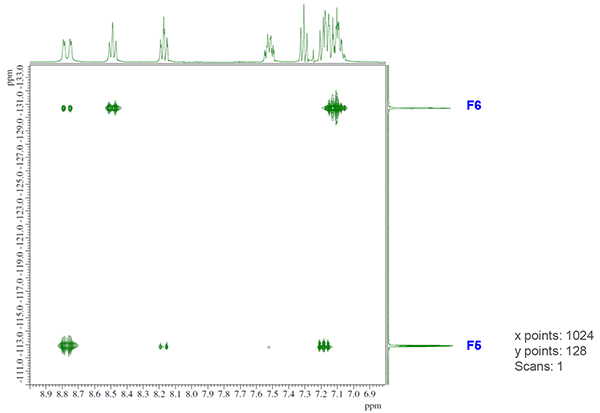
In order to confirm two hydrogen bonds between the amide 1H and 19F atoms, we collected 1H–19F HETCOR under the 14N decoupling condition. 1D-HETCOR spectra of 1 are shown in Fig.2. As expected, we could observe cross peaks to amide 1H with both F atoms (F5, F6). Furthermore, by using anti phase signals in 1D-HETCOR spectra, J constants were clearly observed as ca. 16 Hz (amide-F5) and 3 Hz (amide-F6), respectively in the case of 14N decoupling conditions. 2D-HETCOR spectrum with 14N decoupling is also available, which is shown in Fig.3.

Fig.2 1D-HETCOR spectra of 1 with or without 14N decoupling (A: selective excitation at F5; B: selective excitation at F6).

Fig.3 14N decoupling 2D-HETCOR spectrum of 1
Reference
G. N. Manjunatha Reddy, M. V. Vasantha Kumar, T. N. Guru Row, N. Suryaprakash, Phys. Chem. Chem. Phys., 12, 13232–13237 (2010).
- Please see the PDF file for the additional information.
Another window opens when you click. 
PDF 722.6KB
SEARCH APPLICATIONS
Related Products
Solutions by field
Are you a medical professional or personnel engaged in medical care?
No
Please be reminded that these pages are not intended to provide the general public with information about the products.
