Study of Chemical Exchange by NMR
NM190008E
NMR is a powerful tool for the study of chemical exchange.
When a spin exchanges between two sites with different chemical shifts, then the NMR signal for that spin is largely determined by the time scale of the exchange event.
If the chemical shift difference between the two sites is larger than the exchange rate, then the exchange is described as slow exchange on the NMR time scale. Hallmark of slow exchange is the appearance of two separate NMR signals representing the two states.
Slow exchange can be verified and quantitatively analyzed by a simple 1D NMR experiment.
Selective Inversion Recovery Experiment
In the Selective Inversion Recovery experiment (double_pulse_shape.jxp), one of the two signals under exchange is selectively inverted. Due to exchange, the perturbation of one signal is propagated to the second signal. The magnetization recovery of both signals can be monitored and analyzed in order to extract information about the exchange event.
In order to facilitate fitting, supplementary experiments can be conducted. For instance, the above experiment can be repeated with selective inversion of the second signal or an experiment can be conducted where one of the two signals is selectively saturated.
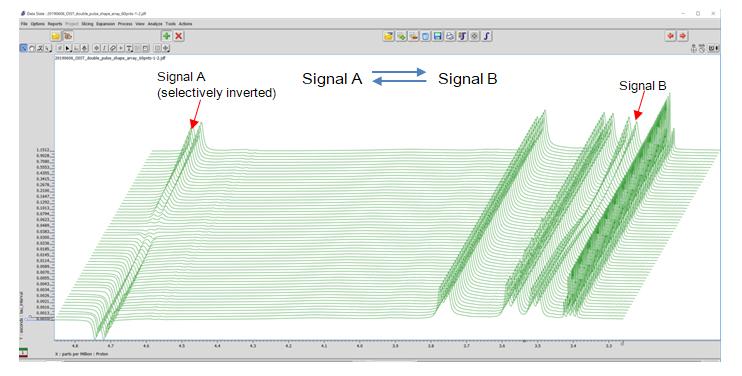
Fig 1: Selective inversion recovery. Data analyzed with Data Slate.
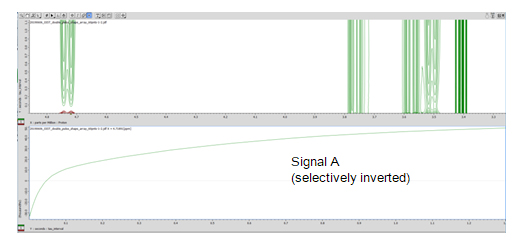
Fig 2: Magnetization Recovery of signal A. Data analyzed with Curve Analysis using peak heights
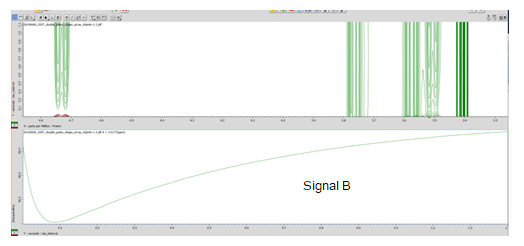
Fig 3: Magnetization Recovery of signal B. Data analyzed with Curve Analysis using peak heights
Data can be exported as txt, csv or excel file for analysis with a third party software. Exported files can easily be prepared with ‘Curve Analysis’ or ‘Kinetics Analysis’ tool.
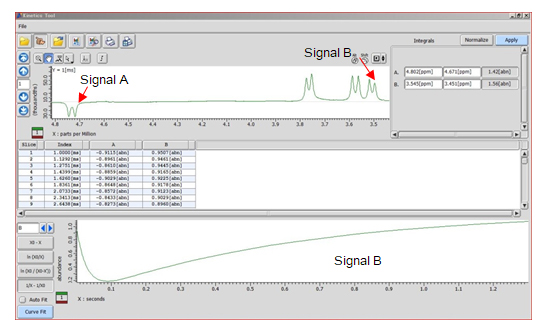
Fig 4: Selective inversion recovery. Data analyzed with ‘Kinetics Analysis’ tool using peak integrals
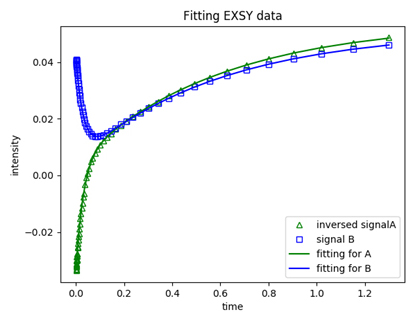
Fig 5: EXSY data analysis. Exported data were analyzed with a in-house prepared python script
Coordination Chemistry and Catalysis Unit, OIST, Japan
Console : JNM-ECZ600R+ROYALPROBETM HFX
Reference
1) J. Magnetic Resonance. 1977, 27, 137-141.- Please see the PDF file for the additional information.
Another window opens when you click. 
PDF 809KB
Related Products
Are you a medical professional or personnel engaged in medical care?
No
Please be reminded that these pages are not intended to provide the general public with information about the products.