CRAFT for Delta Ver. 1.1 —Quantitative analysis of similar molecule mixture—
NM190002
CRAFT (Complete Reduction to Amplitude Frequency Table) [1], the new concept of high-resolution NMR data processing based on the Bayesian analysis [2], is able to convert NMR time domain data (FID; Free Induction Decay) into spreadsheet consisted of amplitude and frequency of each frequency component. Usually we extract quantitative information from NMR data by use of Fourier transform with phase correction, baseline correction, etc.. and then applying integration. CRAFT has a potential to be an alternative approach of those conventional procedures.
CRAFT is an alternative solution for quantitative analysis with mixture samples. Quantitative analysis with mixture samples is challenging research field due to spectral overlap especially in mixtures of similar compounds. Conventional integration is not suitable for quantifying each compound with overlapped peaks. CRAFT can extract quantitative information with overlapped peaks because CRAFT uses multiple exponentially decaying sinusoids (Lorentzian line shape) as a model of the FID. In this note, CRAFT for Delta Ver. 1.1, implemented on the Delta NMR software Ver. 5.3.1, was used for quantitative mixture analysis of pharmaceutical compounds to demonstrate power of CRAFT for mixture analysis.
1H NMR of mixture of pharmaceutical compounds
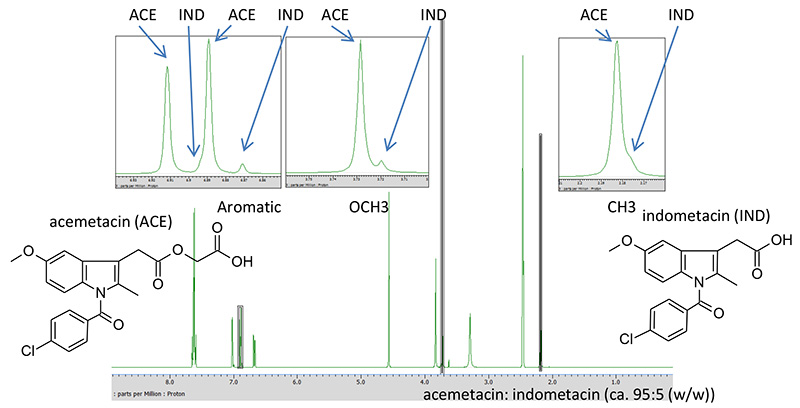
Mixtures of acemetacin and indometacin were used as a test mixture of similar compounds (Figure 1). Acemetacin is a non-steroidal anti-inflammatory drug, and indomethacin is the active anti-inflammatory metabolite of acemetacin. From a viewpoint of chemical structure, acemetacin is a carboxymethyl ester of indometacin. The similar structures of acemetacin and indomethacin in a mixture result in many overlaps in the 1H-NMR spectrum (Figure 1).

Figure 1. 1H-NMR spectrum of a mixture of acematacin-indomethacin, recorded on a JNM-ECZ400S spectrometer with ROYALPROBE™.
Applying CRAFT
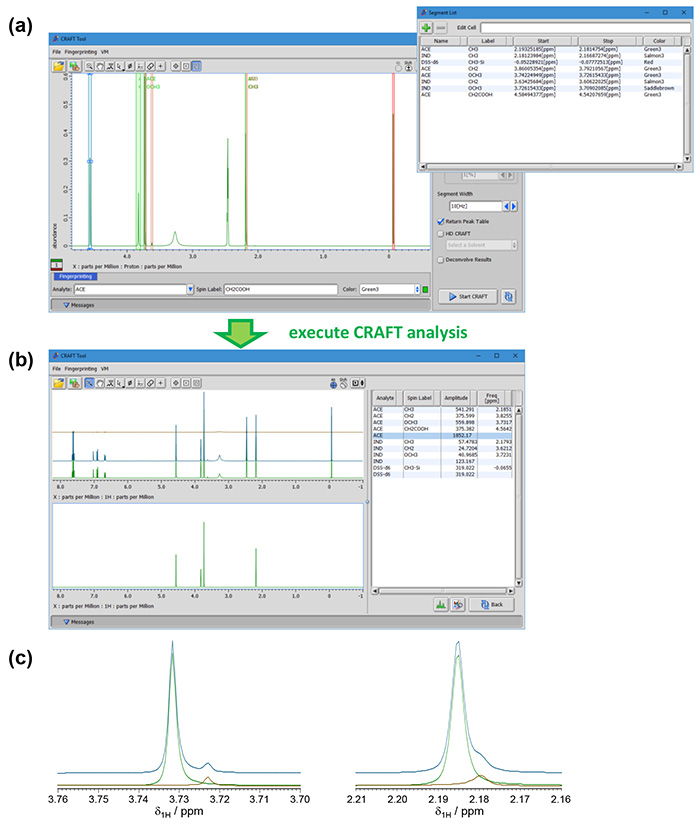
CRAFT analysis was performed with fingerprint settings on each peak (Figure 2(a)). Resultant spreadsheet was based on fingerprint setting (Figure 2(b)). Also it was confirmed that separations of frequency components between acemetacin and indometacin were very well (Figure 2(c)). Therefore absolute amount of acemetacin (purity) can be determined with amplitude of acemetacin and internal standard* with the formula (1).
Here P, A, N, m, and M are purity, amplitude (or integral), number of proton, weight, and molar mass, respectively. Index A and std are analyte and reference compound, respectively.
* Accuracy of amplitude in CRAFT depends on shape of peaks and spectral overlap. Conventional integration is recommended if accuracy is very important in the analysis (ex. Analysis for quality assurance).

Figure 2. CRAFT analysis a mixture of acemetacin and indometacin.
(a) Fingerprint setting. (b) Results of the analysis. (c) Confirmation of peak separations. Green: frequency components of acemetacin, brown: those of indometacin, blue: their sum.
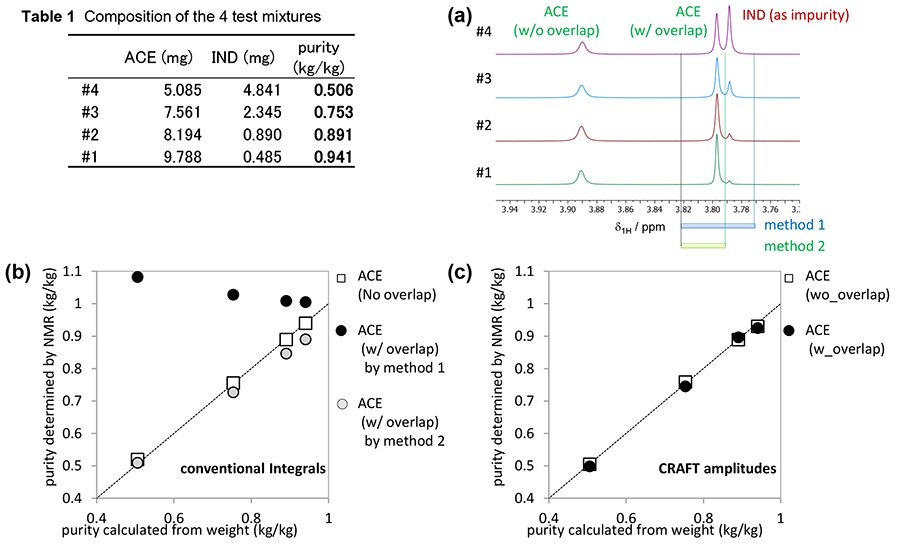
To demonstrate power of CRAFT for mixture quantitative analysis, 1H NMR spectra for CRAFT analysis were recorded using 4 mixtures of varying concentrations for acemetacin and indometacin with ca. 1 mg of 4,4-Dimethyl-4-silapentane-1-sulfonic acid-d6 (DSS-d6) as internal standard substance (dissolved in DMSO-d6). A JEOL JNM-ECZ400S NMR spectrometer with JEOL ROYALPROBE™ were used to collect the NMR data. 1H NMR experiment followed the recommended parameters in the Japanese Industry Standard (JIS) K0138 [4] (briefly spectral width: 20 ppm, digital resolution: 0.25 Hz, w/o sample spinning, w/ 13C decoupling, pulse repetition time: 64 sec). Amount of acemetacin was calculated with amplitudes of 2 peaks, one was overlapped with that from indometacin and another was not (Figure 3(a)).
Comparison between CRAFT and conventional integration is shown in Figure 3(b) and (c). In conventional integration, purities determined by NMR with the non overlapped peak were almost same as those calculated from weight. However purities determined by NMR with the overlapped peak were different from those calculated from weight. Purities determined by CRAFT were almost same as those calculated from weight even if the peak overlapped with indometacin was used. The CRAFT 1H NMR data analysis of the text mixture successfully demonstrates the power of CRAFT for quantitative NMR mixture analysis.

Figure 3. Demonstration of the power of CRAFT for mixture quantitative analysis.
(a) 1H NMR spectra of 4 mixture of acemetacin and indometacin. Purities determined by NMR with (b) conventional integration and (c) CRAFT.
References
- Krishnamurthy; K., Magn. Reson. Chem. (2013) 51, 821–829.
- Bretthorst; G. L., J. Magn. Reson. (1990) 88, 533–551., Bretthorst; G. L., J. Magn. Reson. (1990) 88, 552–570., Bretthorst; G. L., J. Magn. Reson. (1990) 88, 571–595., Bretthorst; G. L., J. Magn. Reson. (1991) 93, 369–394., Bretthorst; G. L., J. Magn. Reson. (1992) 98, 501–523.
- Application note "CRAFT for Delta Ver. 1.1 —Introduction of background and its user interface—" ( NM190001 ).
- JIS K0138:2018, General rules for quantitative nuclear magnetic resonance spectroscopy.
- Please see the PDF file for the additional information.
Another window opens when you click. 
PDF 1,068.1KB
SEARCH APPLICATIONS
Related Products
Are you a medical professional or personnel engaged in medical care?
No
Please be reminded that these pages are not intended to provide the general public with information about the products.
