Application of qNMR:Quality control of organophosphorus pesticides
NM090010E
This Note introduces an application of qNMR to quality control, where purity of commercial organophosphorus pesticides (isoxathion oxon) is determined.
Target compound: Isoxathion oxon
Two standard samples for pesticide residue test, isoxathion oxon, were examined. Information of the products is listed in Table 1.
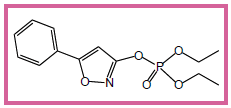 Isoxathion oxon
Table 1. Compound information attached to the products
Isoxathion oxon
Table 1. Compound information attached to the products
| Sample | Lot | Purity(%)* | Appearance | m.p.(℃) |
| starndard isoxathion oxon |
1 | 96.9 | Yellow-brown crystalline powder | 49.5 |
| 2 | 98.9 | White crystalline powder | 51.7 |
qNMR reference
Hexamethyldisilane (HMD) was used as a qNMR reference. HMD gives an NMR signal at 0 ppm but is not SI-traceable, and so its concentration was calibrated with a certified reference material, diethyl phthalate. Thus, SI-treaceability of qNMR measurements using HMD is established.
qNMR measurement conditions
Table 2 shows NMR measurement conditions. Important point is setting a recycle delay to be more than five times of longitudinal relaxation time (T1), preventing from saturation. For the details of quantitative analysis using NMR, please refer to technical information of JEOL homepage.
Table 2. Measurement conditions| Parameter of JNM-ECA600 | |
| Observed nucleus | 1H |
| Observed range | -5ppm~15ppm |
| Data points | 32K |
| Digital filter | ON(8times) |
| Recycle delay | 60s |
| Flip angle | 90° |
| Scans | 8 scan |
| Temperature | 25℃ |
| Spinning | OFF |
For the details of quantitative analysis using NMR, please refer to technical information of JEOL homepage.
Results and discussion
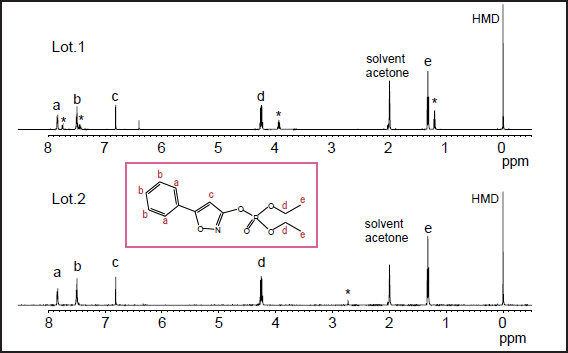
Fig. 1 qNMR spectra of two isoxathion oxon samples
Figure 1 shows NMR spectra of isoxathion oxon Lot.1 and Lot.2. The former spectrum exhibits many impurity peaks (*), suggesting low grade of the product. The concentration deduced from qNMR analysis is listed in Table 3. The result for Lot.2, 98.5±1.3 %, agrees with that in the attached information, while 75.4±0.2 % for Lot.1 is different from 96.9 % in the attached information which is, therefore, considered to be inappropriate. These results are consis- tent with the concentration ratio determined by GC/MS, although GC/MS has uncertainty due to response factors. Thus, qNMR is promising in wide research fields including quality control.
Table 3. Results of quantification analysis of qNMR and GC/MS| NMR peak (ppm) | Average | GC/MS Area ratio |
|||||
| a 7.85 |
b 7.49 |
c 6.81 |
d 4.25 |
e 1.32 |
|||
| Lot.1 | 75.3% (0.8)a) |
75.1% (0.9)a) |
75.5% (0.7)a) |
75.8% (0.9)a) |
75.4% (0.9)a) |
75.4% (0.2)a) |
75.3%b) |
| Lot.2 | 99.0% (0.3)a) |
99.3% (0.5)a) |
96.3% (0.2)a) |
99.4% (0.6)a) |
98.6% (1.1)a) |
98.5% (1.3)a) |
98.5%b) |
b) Value for Lot.2 is assumed to be the same as that from NMR, and value for Lot.1 is calculated using concentration ratio.
Reference
M. Tahara, N. Sugimoto,T. Suematsu et. al, Jpn.J.Food Chem.Safety, 2009, Vol.16(1), 28-33
SEARCH APPLICATIONS
Related Products
Are you a medical professional or personnel engaged in medical care?
No
Please be reminded that these pages are not intended to provide the general public with information about the products.