Magnetic nanoparticles and superparamagnetic resonance (2) "Structure and electronic states of magnetic nanoparticles"
ER210006E
Particle size and specific surface area
When we assume the particle as a sphere, a parameter Ss, which is the ratio of the surface area (S=4𝜋𝑟2) to its volume ![]() , is expressed as
, is expressed as
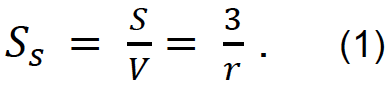
Surface area is in inverse proportion to the particle radius. Ss is the specific surface area, and 𝑟 is the radius of the particle. Figure 1 shows the relation between sphere's diameter and calculated specific surface area according to eq. (1). This plot lets us know that the surface area of the mesoscopic matter is to be very large.
This unique largeness of the specific surface area significantly affects the physical properties of nano-ordered particle materials. This is because the surface poses discontinuous interface, and can generate different electron states from uniform and periodic crystal in the inner region of the particle.
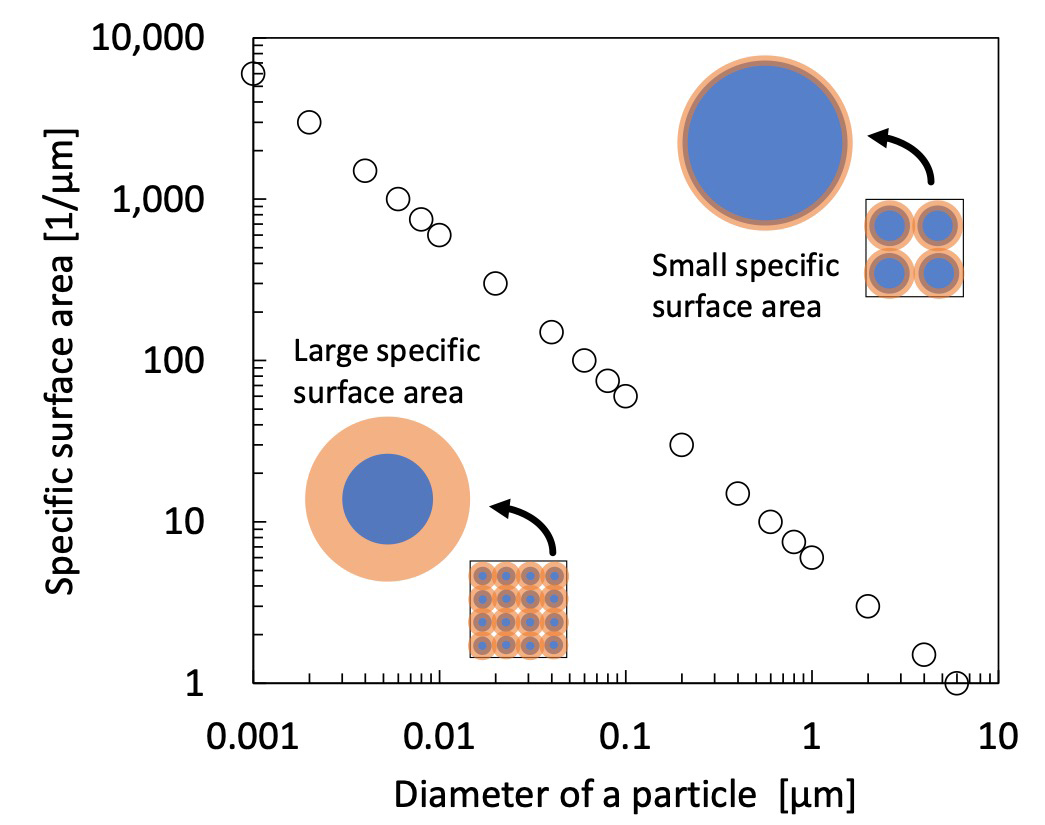
Fig. 1 Particle diameter and specific surface area.
Core-shell structure of magnetic nanoparticles
Magnetic nanoparticles (MNPs) is expected for medical and industrial materials. Therefore, the uniform size regulation of the particle is necessary to obtain the reproductivity or stability, because quantum size effects make the physical properties change drastically. Homogeneity as the materials strongly depends on the narrowness of the size distribution. Above all, evaluation that checks the shape and measures the size distribution using transmission electron microscope (TEM) is important on the process of MNPs synthesis. Moreover, it is advocated that the mesoscopic MNPs hold core-shell structure in the term of magnetic morphology as shown Fig. 2[1-3]. Figure 3 shows superparamagnetic resonance (SPR) spectra and bright field images obtained using TEM and size distribution histograms of different sized MNPs (Fe3O4). These spectral patterns vary drastically with getting smaller a particle size, in spite of the same elemental composition. Furthermore, there seems that each spectrum consists of two components with different line widths (broad and narrow ones). The obtained data by TEM show that particles are sphere and have a uniform size distribution. The data of the TEM support that these spectral variations are strongly correlated to the particle diameters.
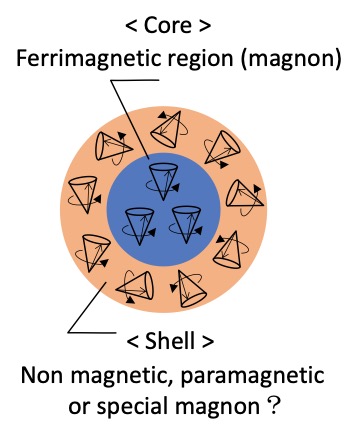
Fig. 2 Core-shell magnetic morphology.
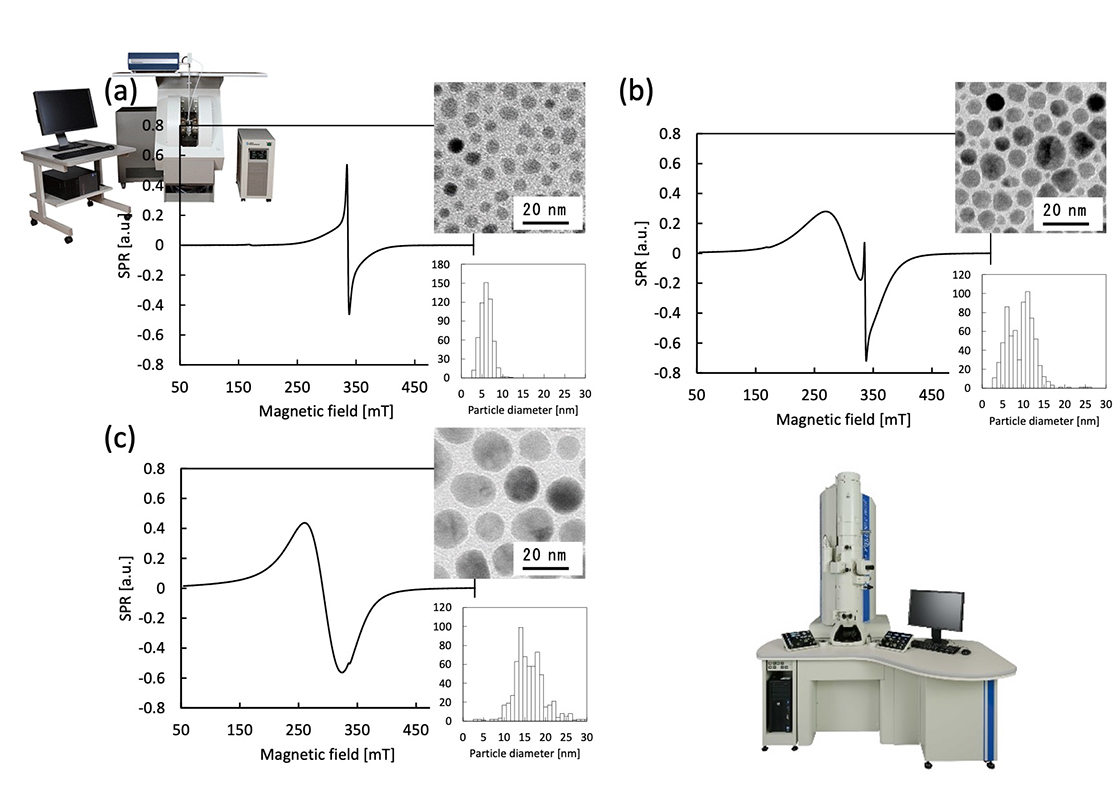
Fig. 3 SPR spectra of Fe3O4 magnetic nanoparticles dispersion in toluene (0.625 mg / mL), images obtained using TEM (JEM-2100Plus, The accelerating voltage is 200 kV) and size distribution of the particles, (a) with diameter of 5 nm, (b) 10 nm, and (c) 20 nm.
Core-shell structure inferred from saturation property of SPR spectra
Electron spins located in the different environments have different energy level spacing and intrinsic interaction. Therefore, each relaxation path or velocity by microwave excitation is not the same, the respective spin has a unique relaxation time (spin-lattice relaxation : T1, spin-spin relaxation : T2). Since the spin relaxation time of the usual ferromagnets is very short, direct observation of relaxation time is very difficult. However, measurements of microwave power dependence (saturation property) make it possible to distinguish different spins.
Spectra shown in Fig. 4 are irradiated power variations of superparamagnetic resonance by MNPs (Fe3O4). It can be seen that every spectrum consists of two components, which are broad one and narrow (g ~ 2) one. As the diameters of the particles are getting smaller, the narrow components ratio is increasing. The narrow components are easy to saturate, but its g-value and line width are constant. On the contrary, the broad components do not saturate even over 160 mW, and its line widths increase with power levels. These spectral properties imply two distinct different spins in a particle, and it leads to support the core-shell structure model of the MNPs[2].
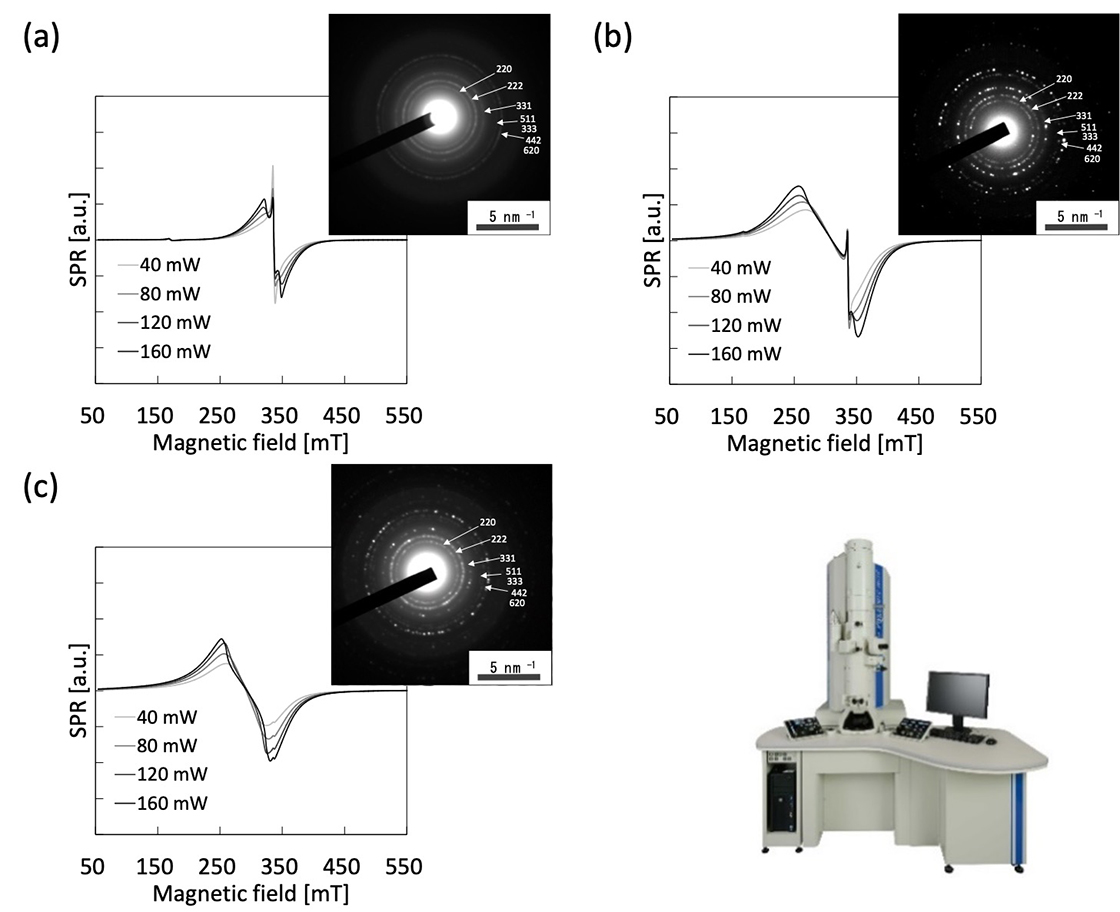
Fig. 4 Microwave power dependence of SPR spectra of Fe3O4 magnetic nanoparticles dispersion in toluene (0.625 mg / mL) and electron diffraction, with a diameter of (a) 5 nm, (b) 10 nm, and (c) 20 nm.
* Electron diffraction patterns were obtained using JEM-2100Plus (the accelerating voltage is 200 kV). Three diffraction patterns of the magnetic nanoparticles as shown in (a) – (c) were coincident with the known diffraction pattern of Fe3O4.
Characterization magnetic nanoparticles by multi-frequency FMR/SPR spectra
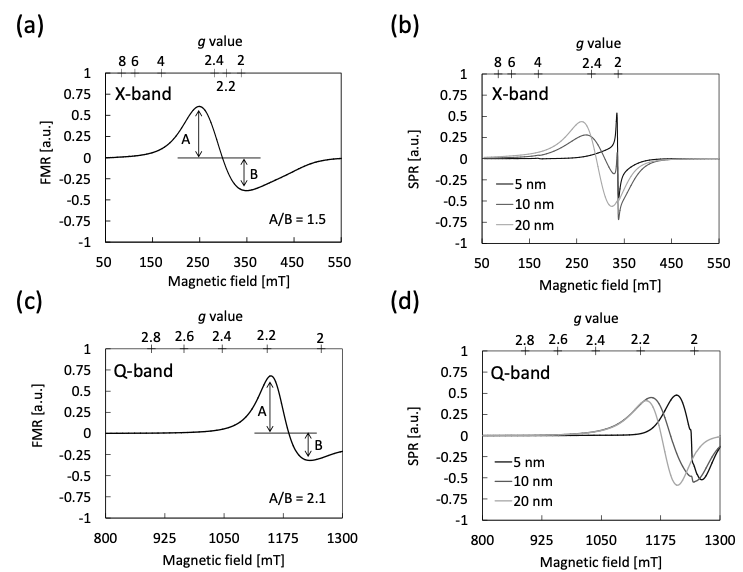
Fig. 5 ESR spectra of magnetite (Fe3O4) particles with different diameters using multi-frequency.
(a) X-band FMR spectrum of Fe3O4 powder with diameter of 50 – 100 nm. (b) X-band SPR spectra of Fe3O4 magnetic nanoparticles dispersion in toluene (0.625 mg / mL). (c) Q-band spectrum of (a). (d) Q-band spectra of (b). Q-band spectra were obtained using ES-SQ5 (as shown above picture).
We show multi-frequency ESR spectra of MNPs (Fe3O4) in Fig.5. These were obtained with X-band (9.4 GHz) and Q-band (35 GHz) spectrometers. Microwaves can not penetrate into the conductive materials over the skin depth, which is dependent on the frequency. The shorter the skin depth is, the more distorted the ESR spectral pattern in Dysonian. As shown in Figs.5 (a) and (c), a Q-band spectrum is more distorted Dysonian pattern than an X-band one. That is, magnetite with this diameter’s range has the electrical conductivity like a bulk crystal as well as the ferrimagnetism. In the case of MNPs, as shown in Figs.5 (b) and (d), the characteristic narrow component ratio of MNPs decreases drastically in Q-band spectra. Similar spectral characters of maghemite (γ-Fe2O3) MNPs, which is iron oxide consisted of different composition, are reported in the previous literature[4], too. The exciting energy (hv) of Q-band microwave is 4 times larger than that of X-band. Therefore, it is interpreted that a unique superparamagnetism might weaken due to a decrease of thermal fluctuation[4].
Reference:
- [1] Y. Komorida, Doctor thesis "Studies of Magnetic and Structural Properties of Magnetic Nanoparticles under Hydrostatic Pressure" (2010).
- [2] S. Tatum, Concepts and Functions of Ferromagnetic Resonance (NY research press , 2015).
- [3] K. L. Krycka et al. Phys. Rev. Lett. 104, 207203 (2010).
- [4] F. Gazeau et al., Journal of Magnetism and Magnetic Materials, 202(2-3), 535-546 (1999).
- Please see the PDF file for the additional information.
Another window opens when you click. 
PDF 903.4 KB
SEARCH APPLICATIONS
Are you a medical professional or personnel engaged in medical care?
No
Please be reminded that these pages are not intended to provide the general public with information about the products.