Dioxins analysis by New JMS-TQ4000GC and software "TQ-DioK"
MSTips No.338
Dioxins are a general term for polychlorinated dibenzo-p-dioxins (PCDDs) and dibenzofurans (PCDFs). Their structures consist of two chlorinated rings. Many congeners differ in terms of number of chlorine atoms and binding sites (Fig. 1). These substances are considered as persistent organic pollutants (POPS) due to their presence in the environment and the health risks associated. A World Health Organization (WHO) study has demonstrated the health risks (carcinogenic and immunotoxic) when population are exposed to them. In addition, dioxins have been regulated by the Stockholm convention on POPs in May 2001. In particular, 17 substances have to be monitored because they are regulated (7 PCDDs and 10 PCDFs). The highest toxic compound is the 2378-TeCDD. Currently, dioxins analysis can be done not only using GC-HRMS but also with GC-MS/MS according to European commission regulation (EU644/2017). Especially, GC-triple quadrupole MS is interesting in terms of handling, instrument size and operating costs. Recently, JEOL has developed a new GC-triple quadrupole MS (JMS-TQ4000GC) and a new dedicated dioxins analysis software called TQ-DioK. In this study, we evaluated JMS-TQ4000GC with TQ-DioK using dioxins standard samples.

Fig 1. The structures of PCDDs(Left) and PCDFs(Right)
Experimental
Standard Sample
The standard PCDDs and PCDFs(PCDD/Fs) solutions (DF-IS-A, DF-ST-A and DF-LCS-C from WELLINGTON Laboratories (CANADA)) were used for the measurement. Then, the range of concentrations for calibration curve was prepared from 0.025 to 1 pg/µL (OCDD and OCDF: 0.05 - 2 pg/µL) (Table 1).
Table 1. Concentrations of each calibration point
| PCDD/Fs | Concentration 12C (pg/µL) | Concentration 13C (pg/µL) |
|---|---|---|
| Cal. 1 | 0.025(OCDD and OCDF 0.05) | 1.25(OCDD and OCDF 2.5) |
| Cal. 2 | 0.05(OCDD and OCDF 0.1) | 1.25(OCDD and OCDF 2.5) |
| Cal. 3 | 0.1(OCDD and OCDF 0.2) | 1.25(OCDD and OCDF 2.5) |
| Cal. 4 | 0.25(OCDD and OCDF 0.5) | 1.25(OCDD and OCDF 2.5) |
| Cal. 5 | 0.5(OCDD and OCDF 1.0) | 1.25(OCDD and OCDF 2.5) |
| Cal. 6 | 1.0(OCDD and OCDF 2.0) | 1.25(OCDD and OCDF 2.5) |
GC-MS/MS measurement conditions
Table 2 shows the GC-MS/MS measurement conditions. A split/splitless inlet was used, and nitrogen gas was applied as collision gas. Table 3 shows the precursor ion, product ion and collision energy (CE). Two specific precursor ions from each non-labeled compound and labeled compound were set.
Table 2. GC-MS/MS measurement conditions
| [GC] | |
|---|---|
| Inj. volume: | 2µL |
| Inlet type: | Split/Splitless |
| Inj. mode: | Splitless (Purge time 1 min, Purge flow 20 mL/min) |
| Inlet temp.: | 280°C |
| Column flow: | 1 mL/min (Constant flow) |
| GC column: | DB-5MS (60 m x 0.25 mm, 0.25 µm) |
| Oven temp.: | 120°C (3 min) → 50°C/min → 200°C (0 min) → 4°C/min → 300°C (5 min) → 40°C/min → 325°C (5 min) |
| [MS] | |
|---|---|
| MS: | JMS-TQ4000GC |
| Ionization: | EI+ |
| Acquisition mode: | High sensitivity mode |
| IS temp.: | 280°C |
| ITF temp: | 280°C |
Table 3. Precursor ion, product ion and CE
| No. | Compound name | Group name | Precursor ion | Product ion | Precursor ion | Product ion | CE(V) |
|---|---|---|---|---|---|---|---|
| 1 | 13C-2378-TeCDF | 13C-T4CDF | 315.9 | 252 | 317.9 | 254 | 25 |
| 2 | 2378-TeCDF | T4CDF | 303.9 | 240.9 | 305.9 | 242.9 | |
| 3 | 13C-1234-TeCDD | 13C-T4CDD | 333.9 | 270 | 331.9 | 268 | 25 |
| 4 | 13C-2378-TeCDD | 13C-T4CDD | 331.9 | 268 | 333.9 | 270 | |
| 5 | 2378-TeCDD | T4CDD | 321.9 | 258.9 | 319.9 | 256.9 | |
| 6 | 13C-12378-PeCDF | 13C-P5CDF | 351.9 | 287.9 | 353.9 | 289.9 | 30 |
| 7 | 12378-PeCDF | P5CDF | 339.9 | 276.9 | 341.9 | 278.9 | |
| 8 | 13C-23478-PeCDF | 13C-P5CDF | 351.9 | 287.9 | 353.9 | 289.9 | |
| 9 | 23478-PeCDF | P5CDF | 339.9 | 276.9 | 341.9 | 278.9 | |
| 10 | 13C-12378-PeCDD | 13C-P5CDD | 367.9 | 303.9 | 369.9 | 305.9 | 25 |
| 11 | 12378-PeCDD | P5CDD | 355.9 | 292.9 | 357.9 | 294.9 | |
| 12 | 13C-123478-HxCDF | 13C-H6CDF | 385.9 | 321.9 | 387.9 | 323.9 | 30 |
| 13 | 123478-HxCDF | H6CDF | 373.8 | 310.9 | 375.8 | 312.9 | |
| 14 | 13C-123678-HxCDF | 13C-H6CDF | 385.9 | 321.9 | 387.9 | 323.9 | |
| 15 | 123678-HxCDF | H6CDF | 373.8 | 310.9 | 375.8 | 312.9 | |
| 16 | 13C-234678-HxCDF | 13C-H6CDF | 385.9 | 321.9 | 387.9 | 323.9 | |
| 17 | 234678-HxCDF | H6CDF | 373.8 | 310.9 | 375.8 | 312.9 | |
| 18 | 13C-123478-HxCDD | 13C-H6CDD | 401.9 | 337.9 | 403.9 | 339.9 | 25 |
| 19 | 123478-HxCDD | H6CDD | 389.8 | 326.9 | 391.8 | 328.9 | |
| 20 | 13C-123678-HxCDD | 13C-H6CDD | 401.9 | 337.9 | 403.9 | 339.9 | |
| 21 | 123678-HxCDD | H6CDD | 389.8 | 326.9 | 391.8 | 328.9 | |
| 22 | 13C-123789-HxCDD | 13C-H6CDD | 401.9 | 337.9 | 403.9 | 339.9 | |
| 23 | 123789-HxCDD | H6CDD | 389.8 | 326.9 | 391.8 | 328.9 | |
| 24 | 13C-123789-HxCDF | 13C-H6CDF | 385.9 | 321.9 | 387.9 | 323.9 | 30 |
| 25 | 123789-HxCDF | H6CDF | 373.8 | 310.9 | 375.8 | 312.9 | |
| 26 | 13C-1234678-HpCDF | 13C-H7CDF | 419.8 | 355.9 | 421.8 | 357.9 | 30 |
| 27 | 1234678-HeCDF | H7CDF | 407.8 | 344.8 | 409.8 | 346.8 | |
| 28 | 13C-1234678-HpCDD | 13C-H7CDD | 435.8 | 371.9 | 437.8 | 373.9 | 30 |
| 29 | 1234678-HpCDD | H7CDD | 423.8 | 360.8 | 425.8 | 362.8 | |
| 30 | 13C-1234789-HpCDF | 13C-H7CDF | 419.8 | 355.9 | 421.8 | 357.9 | 30 |
| 31 | 1234789-HpCDF | H7CDF | 407.8 | 344.8 | 409.8 | 346.8 | |
| 32 | 13C-12346789-OCDD | 13C-O8CDD | 471.8 | 407.8 | 469.8 | 405.8 | 30 |
| 33 | 12346789-OCDD | O8CDD | 459.7 | 396.8 | 457.7 | 394.8 | |
| 34 | 13C-12346789-OCDF | 13C-OCDF | 455.8 | 391.8 | 453.8 | 389.8 | 30 |
| 35 | 12346789-OCDF | OCDF | 443.8 | 380.8 | 441.8 | 378.8 |
Result
The GC-MS/MS method was validated in terms of chromatographic separation, sensitivity and RRF. Some criteria, especially separation and RRF have to comply with EU commission regulation(EU2017/644).
Separation
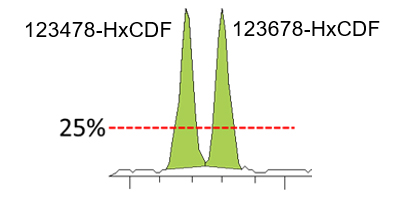
123478-HxCDF and 123678-HxCDF peaks were perfectly separated by using GC-MS/MS method (Fig.2). Indeed, EU commission regulation in force, allows a 25% valley between these 2 peaks.

Fig. 2 Separation of 123478-HxCDF and 123678 HxCDF.
Sensitivity
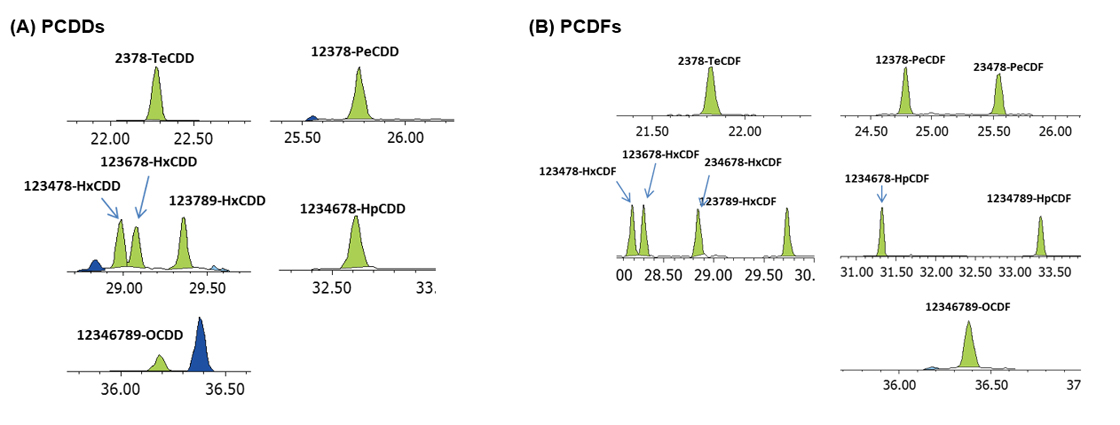
All target compounds in the lowest calibration point were detected (Fig.3). In addition, the lowest calibration point was measured 8 times for the instrument detection limit (IDL) determination. Then, IDL was calculated using 2378-TeCDD. As a result, IDL value was equal to 4 fg (Fig.4).

Fig. 3 Average SRM chromatograms of PCDDs(A) and PCDFs(B) in calibration point 1.

Fig. 4 IDL data by 2378-TeCDD
RRF
Fig. 5 shows calibration curves of 2378-TeCDD and 2378-TeCDF. Table 4 shows the result of relative standard deviation (RSD) of relative response factor (RRF) for the lowest calibration point, average of RRF, RSD of RRF and limit of quantification (LOQ). RSD of RRF obtained with the lowest calibration point was between 2.2 and 12.9 %. Average of RRF value was between 0.94 and 1.14. According to EU regulation, RSD for RRF has to be under 15% . Here, RSD of RRF from the average of all calibration points was within 9.1 % . Regarding LOQ, its value was calculated by signal-to-noise (S/N = 3) of the lowest calibration point. As a result, obtained LOQ value was between 0.08 and 1.69 fg/µL.

Fig. 5 Calibration curve of 2378-TeCDD(A) and 2378-TeCDF(B)
Table 4. Results of RSD of RRF for the lowest calibration point, average of RRF, RSD of RRF and LOQ
| Compound | Lowest calibration point (pg/µL) |
RSD of RRF by the lowest calibration point (%) |
Average of RRF | RSD of RRF (%) |
LOQ (fg/µL) |
|---|---|---|---|---|---|
| PCDFs | |||||
| 2378-TeCDF | 0.025 | 2.2 | 1.04 | 1.8 | 0.13 |
| 12378-PeCDF | 0.025 | 2.3 | 1.04 | 2.4 | 0.45 |
| 23478-PeCDF | 0.025 | 4.0 | 1.05 | 3.9 | 0.68 |
| 123478-HxCDF | 0.025 | 3.7 | 1.00 | 2.9 | 0.40 |
| 123678-HxCDF | 0.025 | 12.9 | 1.00 | 6.1 | 0.36 |
| 234678-HxCDF | 0.025 | 8.7 | 1.03 | 5.6 | 0.42 |
| 123789-HxCDF | 0.025 | 5.3 | 1.01 | 3.5 | 0.35 |
| 1234678-HeCDF | 0.025 | 4.2 | 1.07 | 4.0 | 0.08 |
| 1234789-HpCDF | 0.025 | 5.5 | 1.04 | 4.0 | 0.08 |
| 12346789-OCDF | 0.050 | 4.1 | 0.95 | 9.1 | 1.19 |
| PCDDs | |||||
| 2378-TeCDD | 0.025 | 3.6 | 1.14 | 3.1 | 0.41 |
| 12378-PeCDD | 0.025 | 5.4 | 1.00 | 4.1 | 0.21 |
| 123478-HxCDD | 0.025 | 12.5 | 1.00 | 6.4 | 1.46 |
| 123678-HxCDD | 0.025 | 12.5 | 0.94 | 8.6 | 1.69 |
| 123789-HxCDD | 0.025 | 5.9 | 1.03 | 4.5 | 1.11 |
| 1234678-HpCDD | 0.025 | 8.9 | 1.10 | 5.8 | 0.22 |
| 12346789-OCDD | 0.050 | 8.3 | 1.03 | 9.0 | 0.90 |
Conclusion
The JMS-TQ4000GC was evaluated for dioxins quantification. The results have shown that the JMS-TQ4000GC instrument complies with the EU commission regulation. These results show that the JMS-TQ4000GC system associated with TQ-DioK software are a powerful tool for analyzing dioxins.
Acknowledgement
All measurements and evaluation about the basic performances of JMS-TQ4000GC were organized and tested by the 'LABoratoire d’Etude des Résidus et Contaminants dans les Aliments (LABERCA), Nantes, France.
- Please see the PDF file for the additional information.
Another window opens when you click. 
PDF 1MB
Related Products
Are you a medical professional or personnel engaged in medical care?
No
Please be reminded that these pages are not intended to provide the general public with information about the products.
