GC nitrogen carrier gas solution: Comparing helium and nitrogen in GC-TOFMS exact mass analysis
MSTips No.317
Introduction
The global shortage of helium (He), which is used as a GC carrier gas, is becoming a serious issue for various research organizations. As replacement carrier gases such as hydrogen (H2) and nitrogen (N2) are being tried, nitrogen, which is inexpensive and safe, is attracting increased attention. However, nitrogen as a GC carrier gas is known to compromise peak separation and sensitivity of chromatograms as well as qualitative analysis accuracy due to changes in mass spectral data, collectively affecting the analytical results.
In this work, we examined the effects of nitrogen carrier gas on the performance of our GC-TOFMS for high resolution, accurate mass analysis. As a model application, an acrylic resin, which was introduced in MS Tips 300 , was subjected to pyrolysis analysis. EI and FI were used for ionization. Resulting exact mass data was analyzed by msFineAnalysis to derive estimated molecular formulas. The above measurement was performed with helium and nitrogen carriers, and resulting chromatograms and exact mass data were compared to examine the effect of the carrier gases. The EI/FI ion source used for the measurement has an advantage that it does not affect sensitivity when nitrogen is used as a carrier, as discussed in MS Tips 299 . Therefore, it was expected that the analytical results with nitrogen carrier gas would be comparable to those with helium carrier gas.
Experiment
A commercial acrylic resin was used in the same manner as described in MS Tips 300; 0.2 mg for EI and 1.0 mg for FI. Measurement conditions for pyrolysis-GCTOFMS were based on those in MS Tips 300 except that the column flow rate was changed to 1.0 mL/min for helium and 0.55 mL/min for nitrogen according to their respective optimum linear velocity. Table 1 shows the measurement conditions.
In the acquired results, peak separation and sensitivity (intensity and S/N) were compared in the total ion current chromatograms (TICC) and extracted ion chromatograms (EIC) for representative compounds. Using the msFineAnalysis integrated analysis, the estimated molecular formulas were derived for the top 100 most intense peaks. For fairness, auto analysis results were compared without data processing. Factors such as mass accuracy, isotopic pattern matching, and EI fragment ion cover ratio, in addition to peak separation and sensitivity of chromatograms, affect the determination of estimated compounds, thus making comprehensive evaluation of the exact mass analysis possible.
Table 1. Measurement Conditions
| Pyrolysis conditions | |
|---|---|
| Pyrolyzer | EGA/PY-3030D (Frontier Lab) |
| Pyrolysis Temperature | 600°C |
| GC conditions | |
| Gas Chromatograph | 7890A GC (Agilent Technologies) |
| Column | ZB-5MSi (Phenomenex) 30 m x 0.25 mm, 0.25 μm |
| Oven Temperature | 40°C (2min) -10°C / min -320°C (15min) |
| Injection Mode | Split mode (100:1) |
| Carrier flow | He: 1.0 mL / min N2: 0.55 mL / min |
| MS conditions | |
|---|---|
| Spectrometer | JMS-T200GC (JEOL Ltd.) |
| Ion Source | EI/FI combination ion source |
| Ionization | EI+: 70 eV, 300 μA FI+: -10 kV, 40 mA / 30 msec |
| Mass Range | m/z 35-800 |
| Data processing condition | |
| Software | msFineAnalysis (JEOL Ltd.) |
| Library database | NIST17 |
| Tolerance | ±5mDa |
| Electron | Odd |
| Element set | C: 0-50, H: 0-100, O: 0-10 |
Measured Results
TICC Comparison
Figures 1 and 2 show the TICC data acquired by EI and FI, respectively. In the pyrolysis analysis of the acrylic resin, highly intense peaks for methyl acrylate (MA) and methyl methacrylate (MMA) were observed early in the measurements. Later, multiple dimers and trimers were observed at 10 and 17 minutes, respectively. When nitrogen gas was used, because the column flow rate was reduced, the retention time was increased by approximately 1 minute for most peaks while chromatographic peak separation was comparable to that of helium. The level of sensitivity, one of the concerns for nitrogen as a carrier gas, was also comparable in some cases while reduced to approximately 1/2 in other cases. This relatively small drop in EI sensitivity is likely related to the open design of the EI/FI ion source (reduced space charging) while FI does not efficiently ionize the nitrogen carrier.
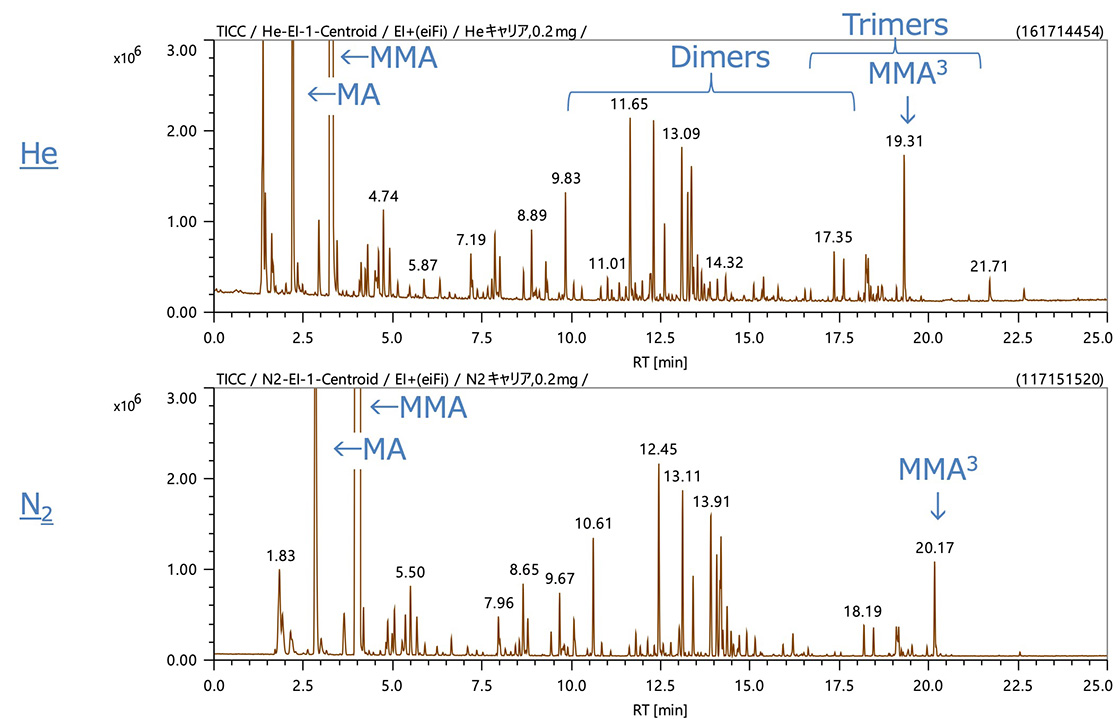
Figure 1. TICC data acquired by EI
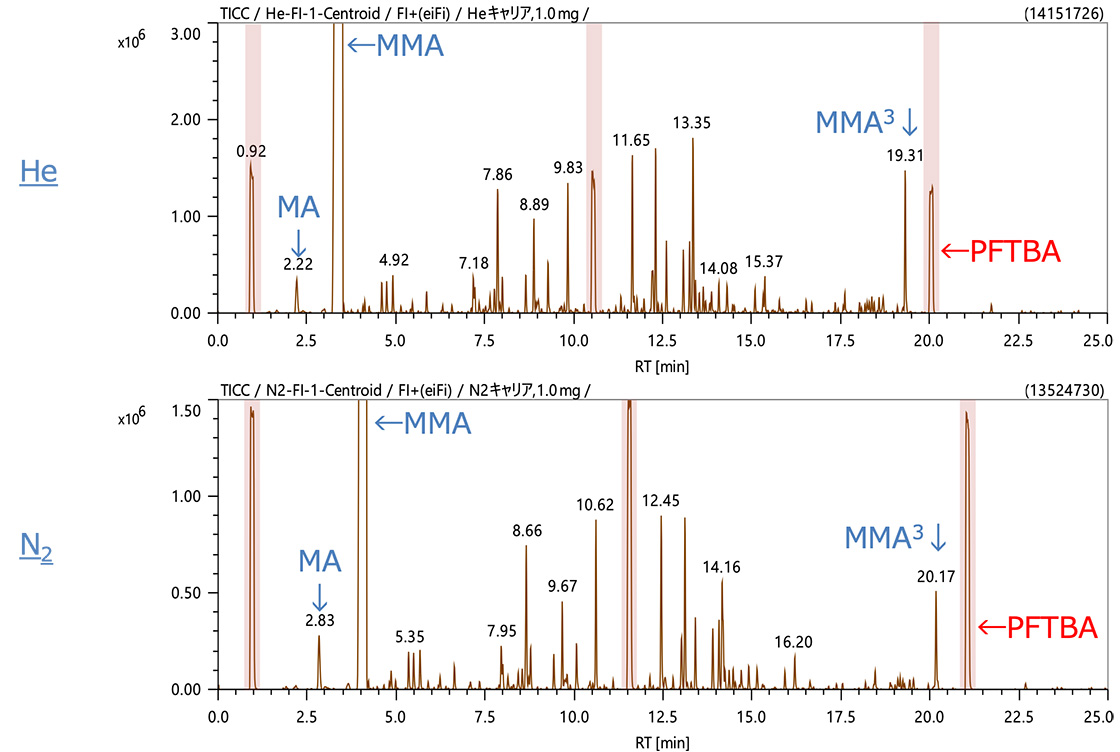
Figure 2. TICC data acquired by FI
EIC Comparison
Figure 3 shows the EIC of the base ion of MMA3, a typical trimer, acquired by EI and FI, respectively. In the EIC data, the EI peak shape was nearly equal between helium and nitrogen carrier gases. Peak intensity and S/N declined to less than 1/2 when nitrogen was used with FI.
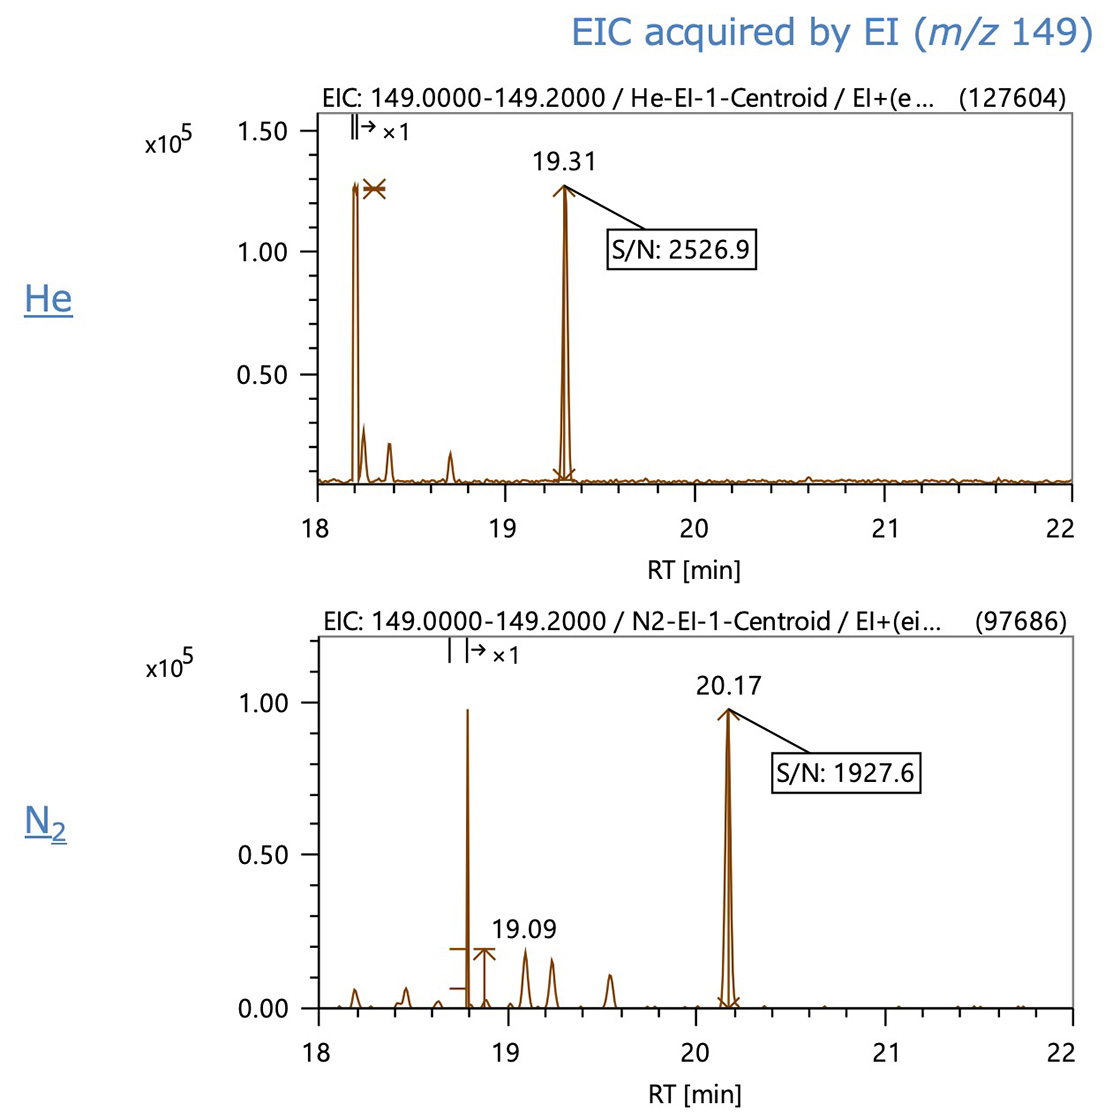
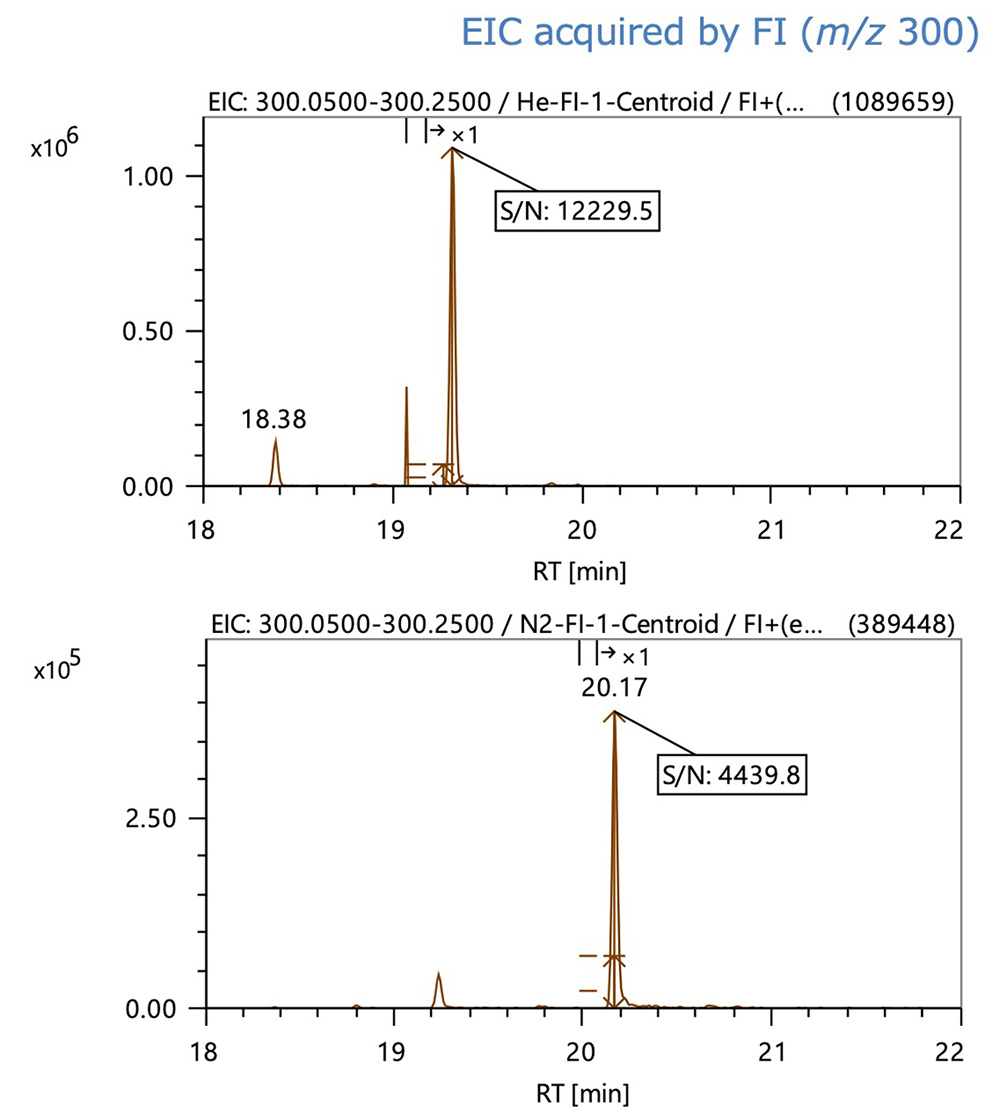
Figure 3. EIC data of MMA3
Results of msFineAnalysis
Figure 4 is a screen shot of msFineAnalysis integrated analysis results. The top views show the TICCs acquired by EI and FI. The peak list at the bottom shows the estimated molecular formulas that are automatically color-coded according to the number of candidates, thus simplifying the output view for the analyst.
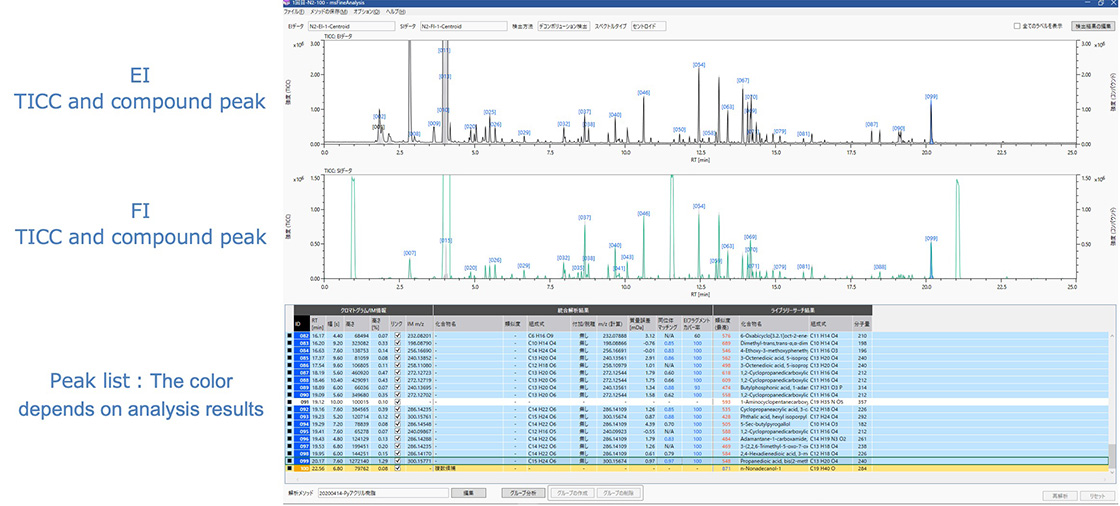
Figure 4. Screen shot of msFineAnalysis (results of N2 carrier)
Compound peaks
msFineAnalysis performs peak assignments based on the results of peak deconvolution. Figure 5 shows the TICC data and compound peaks acquired by EI. Because the retention times are different between helium and nitrogen, overlapping peaks in the TICC data were separated slightly differently. However, peak deconvolution separated these overlapping peaks, making peak assignment possible. The msFineAnalysis auto analysis results showed that 92 peaks out of the top 100 most intense peaks were identified as the same components between helium and nitrogen. The remaining peaks were low in intensity and were identified slightly differently between helium and nitrogen. However, the overall results were comparable.
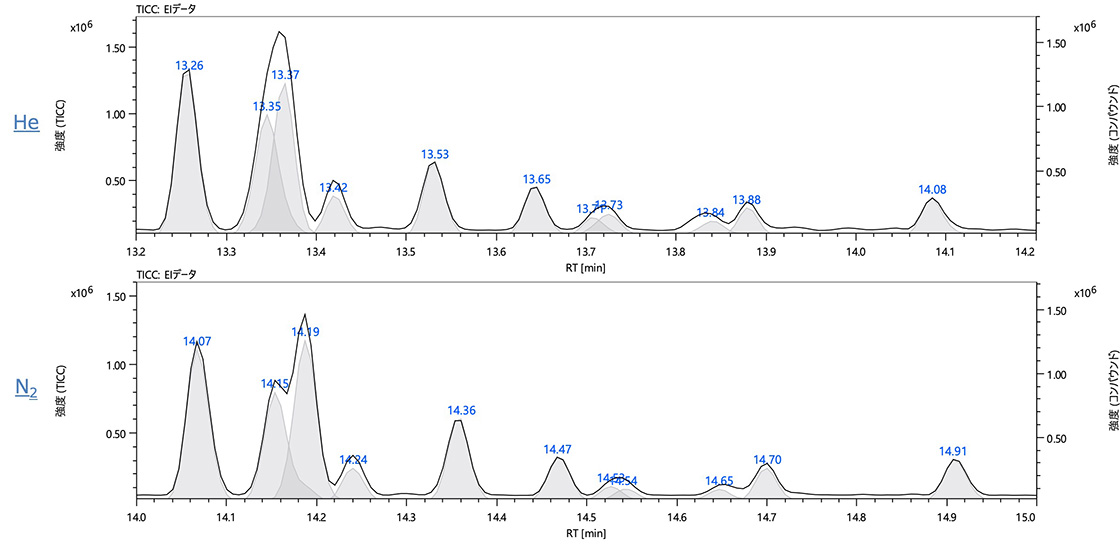
Figure 5. TICC data and compound peaks acquired by EI
Number distribution of estimated molecular formulas
Figure 6 shows the number distribution of estimated molecular formulas for the top 100 peaks. The graph reflects the color-coding used by msFineAnalysis according to the number of candidates for estimated molecular formula assigned to each peak: blue for one candidate; orange for multiple candidates; and gray for none. Results were nearly equal between helium and nitrogen. In both cases, molecular formulas for ~90% of the peaks were uniquely determined.
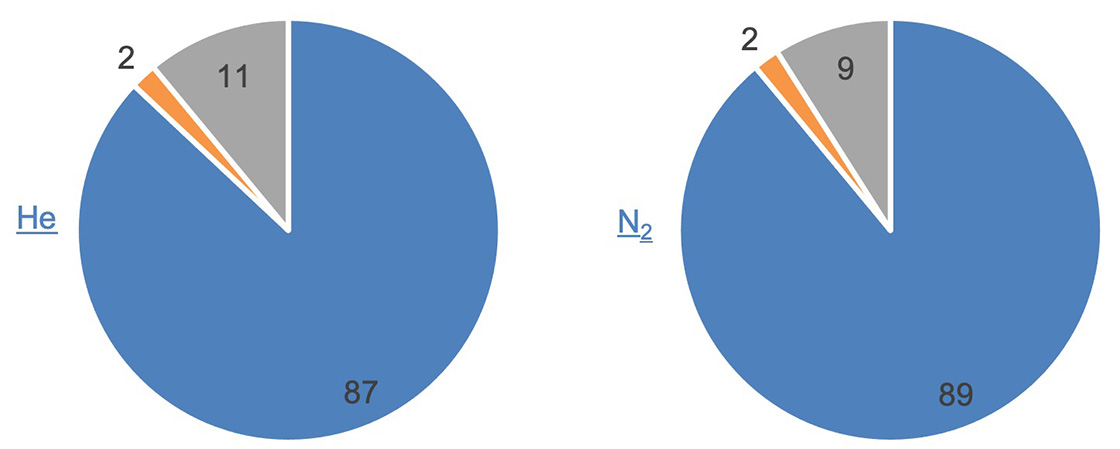
Molecular formula:
Blue: One
Orange: Two or more
Gray: None
*Colors reflect those used in the msFineAnalysis peak list
Figure 6. Number distribution for the estimated molecular formulas
Summary
An acrylic resin sample was measured by using pyrolysis/GC-HRTOFMS with helium and nitrogen as the GC carrier gas, and the results were compared to each other. Peak shape and chromatographic separations were equal between helium and nitrogen. The level of sensitivity, one of the concerns when using nitrogen as a GC carrier gas, was equal to or reduced by approximately 1/2 when the EI/FI ion source was used for the measurements.
msFineAnalysis was used to estimate molecular formulas for the top 100 peaks. The number of candidates identified was nearly equal between helium and nitrogen, suggesting that mass accuracy was not compromised when nitrogen was used as the GC carrier gas. These results demonstrate that exact mass analysis using our GC-TOFMS was effective when using nitrogen as the carrier gas.
- Please see the PDF file for the additional information.
Another window opens when you click. 
PDF 1.5 MB
Related Products
Solutions by field
Are you a medical professional or personnel engaged in medical care?
No
Please be reminded that these pages are not intended to provide the general public with information about the products.