Mass spectrometry imaging for degradation of polyethylene terephthalate by UV irradiation using JMS-S3000 "SpiralTOF™-plus"
MSTips No. 307
Introduction
Matrix assisted laser desorption/ionization (MALDI) mass spectrometry is a powerful tool for the analysis of synthetic polymers.
This technique, when combined with a high-resolution time-of-flight mass spectrometer, can be used to identify differences in monomer, polymer end groups, and their molecular weight distributions. The molecular weight distribution is often expressed as number average molecular weight (Mn), weight average molecular weight (Mw), and dispersity (D). More recently, MALDI mass spectrometry imaging (MALDI-MSI) has been used to visualize the locations of compounds on sample surfaces. However, this technique has not been widely used for polymer analysis. Previously in MSTips 306, we reported combining Mn, Mw and D visualization methods with Kendrick mass defect (KMD) analysis. In this report, we have applied this combined method to analyze a polyethylene terephthalate (PET) that was degraded by ultraviolet (UV) irradiation.
Experiment
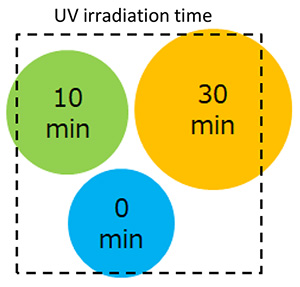
Figure 1 Schematic of the model sample.
Polyethylene terephthalate (PET) was dissolved in hexafluoroisopropanol (HFIP) at 10 mg/mL. The matrix acetophenone (THAP) was dissolved in tetrahydrofuran (THF) at 10 mg/mL. First, the PET solution was spotted in the upper right section of the measurement area, and UV irradiation was performed using a Handicure 100 lamp (manufactured by Mizuka Planning Co.) for 20 minutes. Afterwards, the UV irradiation was interrupted, and the PET solution was spotted in the upper left section of the measurement area. Next, both sections were exposed to UV irradiation for 10 minutes.
Subsequently, the PET solution was spotted onto the lower section of the measurement area. As a result, the UV irradiation time for each spot was 30, 10 and 0 minutes as shown in Figure 1. Afterwards, the THAP matrix solution was airbrushed onto the sample and then the JMS-S3000 positive ion SpiralTOF mode was used to measure MALDI-MSI data. The laser spot size/pixel size was 50 µm. The MSI analysis and visualization was performed by using the JEOL msMicroImager™ software, and the KMD analysis was performed by using the JEOL msRepeatFinder software.
Results
The average mass spectrum for the entire sample region is shown in Figure 2A. A KMD plot for C10H8O4 (monomer unit for PET) is shown in Figure 2B and clearly shows two horizontal series with 192u intervals corresponding to the PET polymer. Series I (highlighted in blue) represents the [M+Na]+ for the cyclic PET oligomer that are present in the sample prior to UV irradiation. Series II (highlighted in red) appeared in the samples after UV irradiation and likely originated from photo-oxidative degradation in which the PET has COOH/COOH end groups.
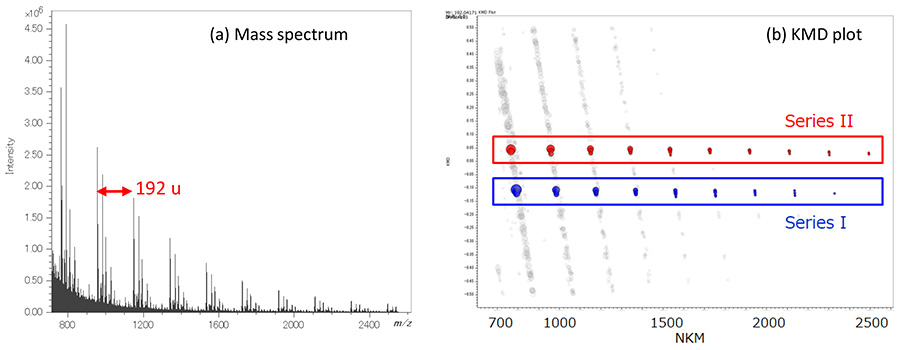
Figure 2 (a) Averaged mass spectrum for the whole measurement region and (b) KMD plot for C10H8O4. Series I represents the cyclic PET oligomers, and Series II represents the photo-oxidative degradation of PET.
The summed intensity images for series I and II are shown in Figure 3. These images were made by summing the mass image intensities for the masses included in the groups that were highlighted as red and blue in the KMD plot. Series I had the strongest ion intensity before UV irradiation (0 min) and decreased as the UV irradiation time increased. Series II was not observed before UV irradiation(0 min),and then the ion intensities increased as the irradiation time increased. Figure 4 shows the ROI (region of interest) mass spectra of UV irradiation time 0, 10, and 30 min. Before UV irradiation (0 min), the [cyclic oligomers+Na]+ (Series I) and the [cyclic oligomers+C2H4O]+ (Series III) were observed in the mass spectrum. However, as the UV irradiation time increased, the ion intensities for these series decreased. On the other hand, Series II with COOH/COOH end groups and Series IV with COOH/OH end group, which were not observed before UV irradiation, showed increased intensities as the UV irradiation increased.
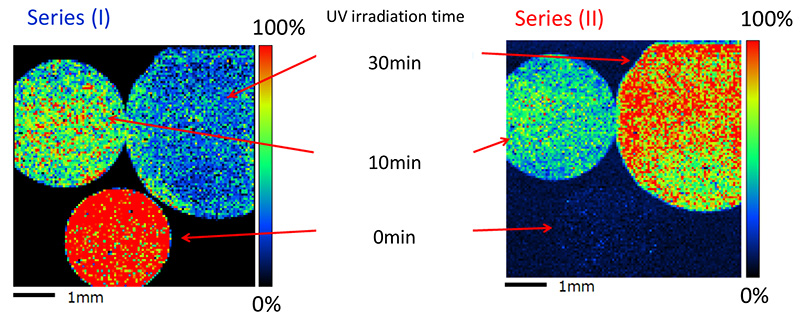
Figure 3 Images for the PET cyclic oligomer series (Series I) and the ultraviolet degraded PET polymer series (Series II).
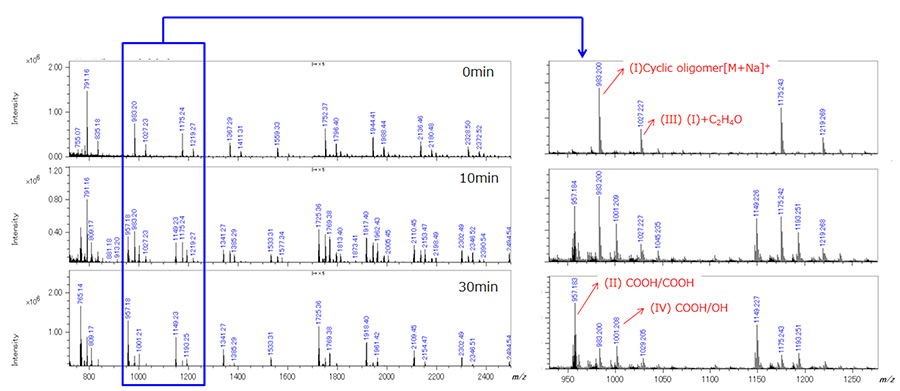
Figure 4 ROI mass spectra of UV irradiation time 0, 10 and 30 minutes. The originally observed polymer series, I and III, had reduced intensities as the irradiation time increased. On the other hand, the polymer series generated by photo-oxidative degradation, II and VI, had increased intensities as the irradiation time increased.
Conclusion
In this work, we have reported a new MSI method for analyzing the degradation of synthetic polymers (in this case UV degradation of PET). As a result, using this technique with the high mass-resolution MALDI-SpiralTOF™ system, we were able to easily observe a decrease in the original series as degradation occurred as well as the appearance and increase of a newly generated series that resulted from the degradation. These results indicate that MALDI-MSI can be an effective for visualizing the degree of degradation and their spatial distributions.
- Please see the PDF file for the additional information.
Another window opens when you click. 
PDF 996.8 KB
Related Products
Are you a medical professional or personnel engaged in medical care?
No
Please be reminded that these pages are not intended to provide the general public with information about the products.