How to read NMR spectra from the basics (chemical shift, integration ratio, coupling)

This column provides easy-to-understand explanations about what we can learn from the NMR spectra (chemical shift, integration ratio, coupling)
What we can learn from the NMR spectra
- Horizontal axis(chemical shift): Information on the type of functional group and molecule conformation
- Integration ratio(signal area ratio): Information on quantities such as composition ratios, mixing ratios, etc.
- Splitting pattern(coupling): Information on neighboring atoms
There are three main things that we can learn from the NMR spectra.
The first is information about the horizontal axis, called the chemical shift. The horizontal axis contains
information about the type of functional group and molecule conformation . From the position where the
spectrum appears (numerical value on the horizontal axis), it is possible to predict what kind of functional
group and molecule conformation are contained in the molecule to be measured.
The second is the integration ratio (signal area ratio). By comparing the integral values of each signal, it
is possible to compare the number of functional groups contained in a molecule and to obtain information on
the mixing ratio of a mixed sample consisting of multiple molecules.
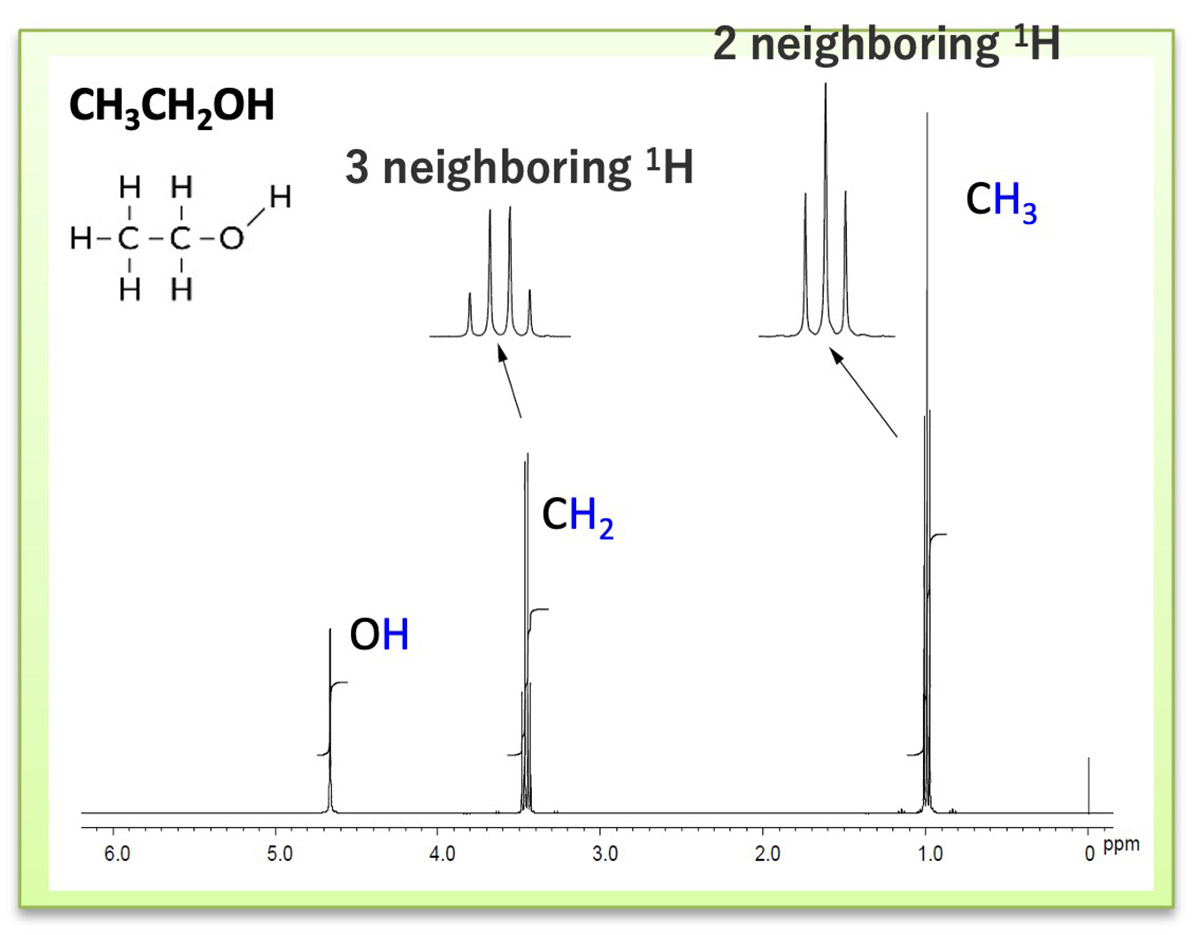
The third is a signal splitting called coupling. The signal is split due to the influence of another nuclear
spin existing near the nuclear spin of interest. Figure 1 shows the 1H NMR spectrum of ethanol. The methyl
and methylene group signals show that the signal is not a single signal, but is split into multiple signals.
Since the splitting pattern of the signal depends on the number and type of other nuclear spins existing
nearby, it is possible to predict the substituents contained in the system from the splitting pattern.
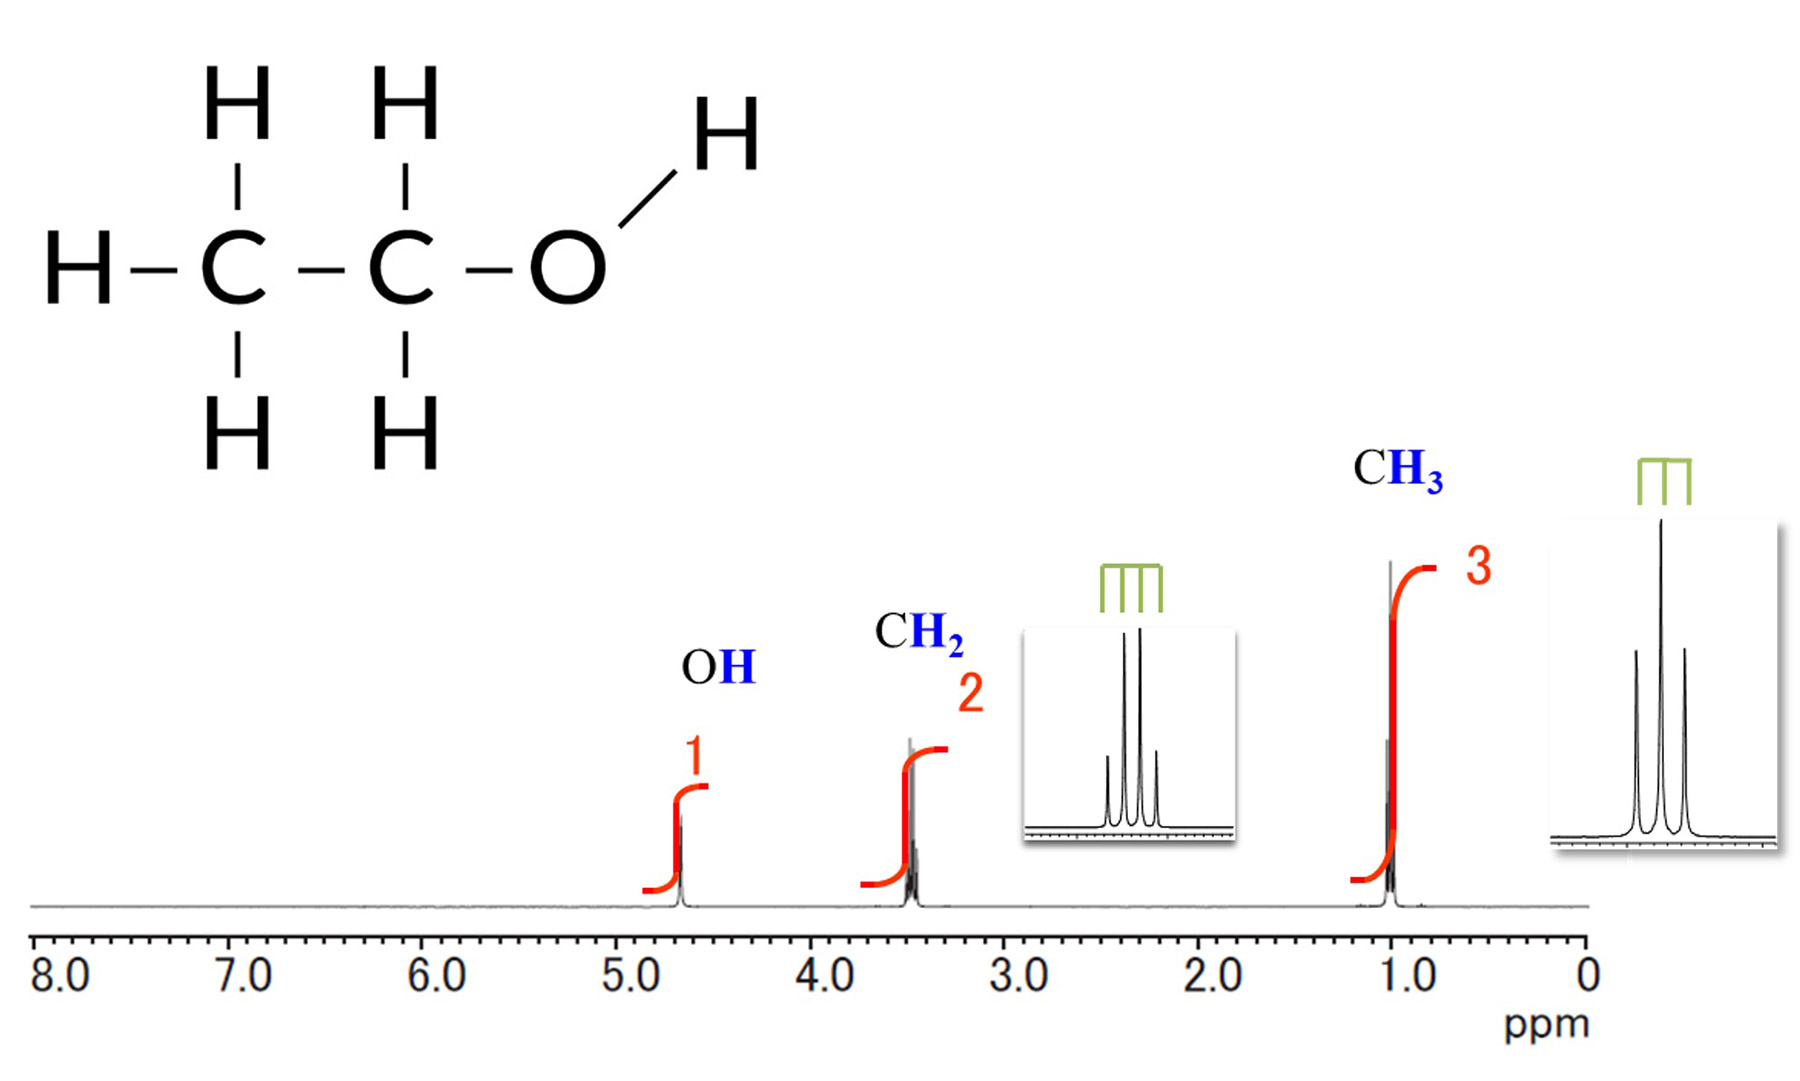
Fig.1 1H NMR spectrum of ethanol (CH3CH2OH)
Reasons for causing differences in horizontal axis (chemical shift)
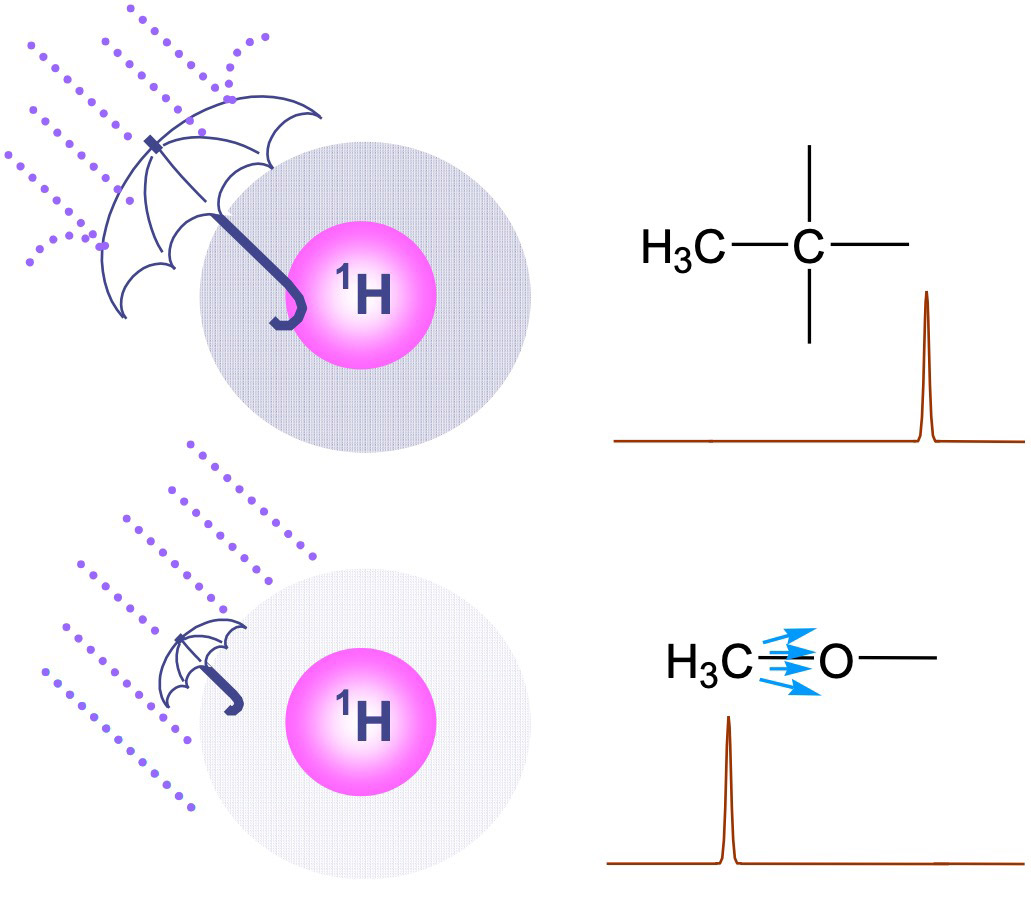
Fig. 2 Difference of strength of shielding the magnetic field
The difference of chemical shift is due to the strength of the magnetic field
received (felt) by the nuclear spin we are focusing on.
As shown in Fig 2. depending on the height of the electron density existing near the nuclear spin, the
strength of shielding of the magnetic field (the strength of the magnetic field that the nuclear spin
receives) varies.
The electron density existing near the nuclear spin depends on the magnitude of the electronegativity of
the atoms existing near the nuclear spin of interest.
When an O (oxygen) atom with high electronegativity exists nearby, electrons are attracted by the O
atom, the electron density near the nuclear spin of interest decreases, and the magnitude of the
magnetic field that the nuclear spin receives becomes greater.
As the electron density near the nuclear spin decreases(shielding becomes lower), the corresponding
signal shifts to the left.
Example of chemical shift table of 1H
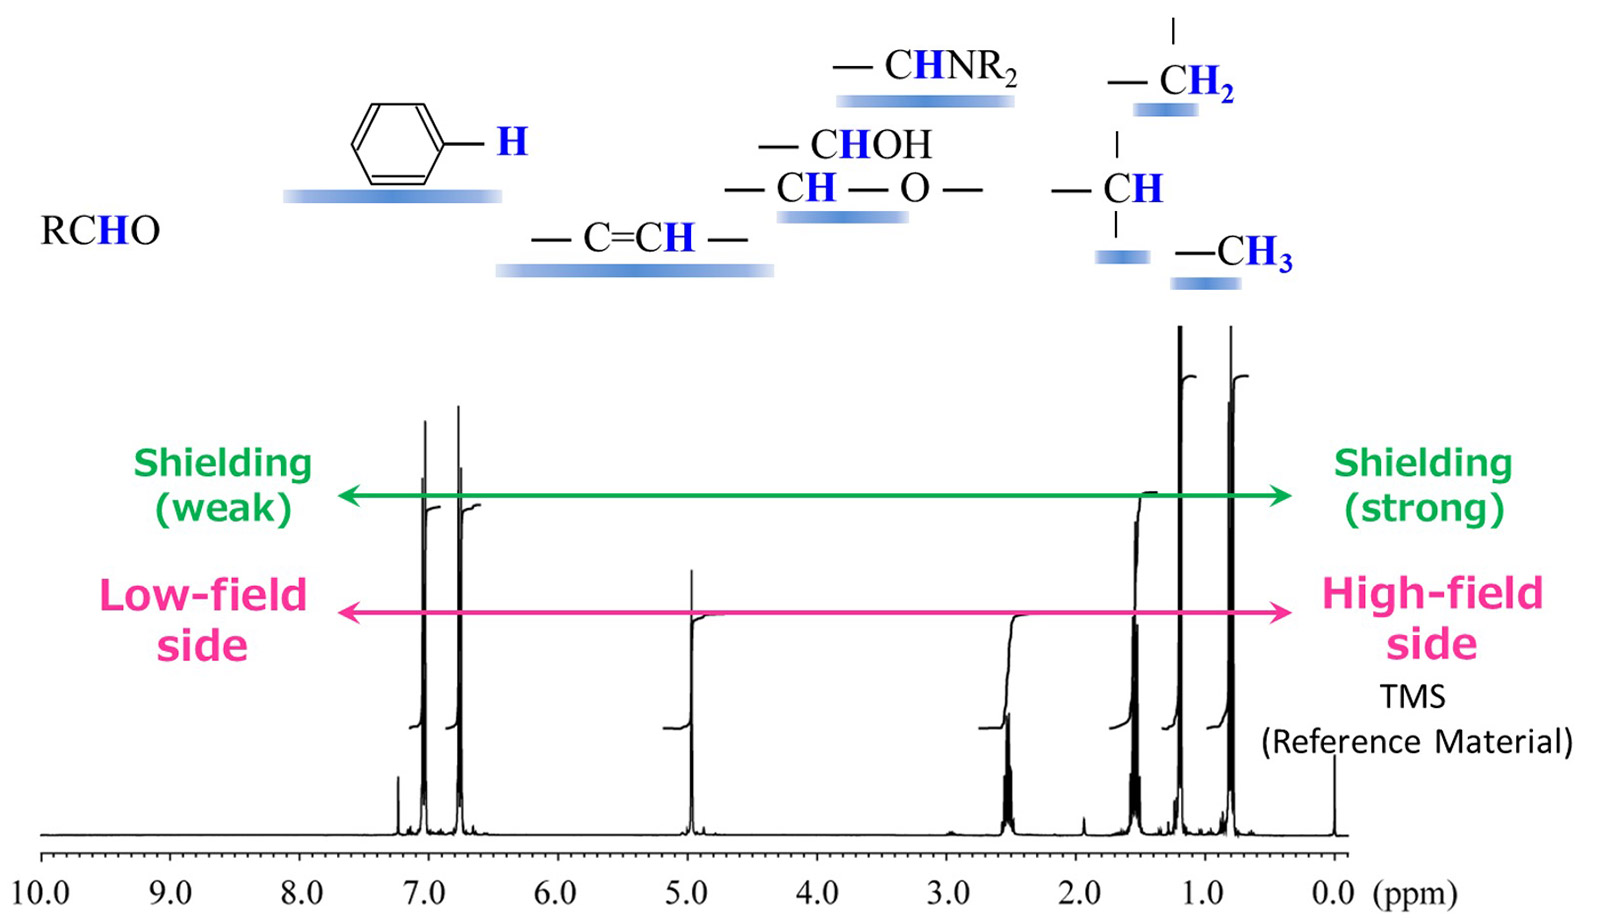
Fig. 3 Correlation diagram of typical functional groups and 1HNMR signal positions
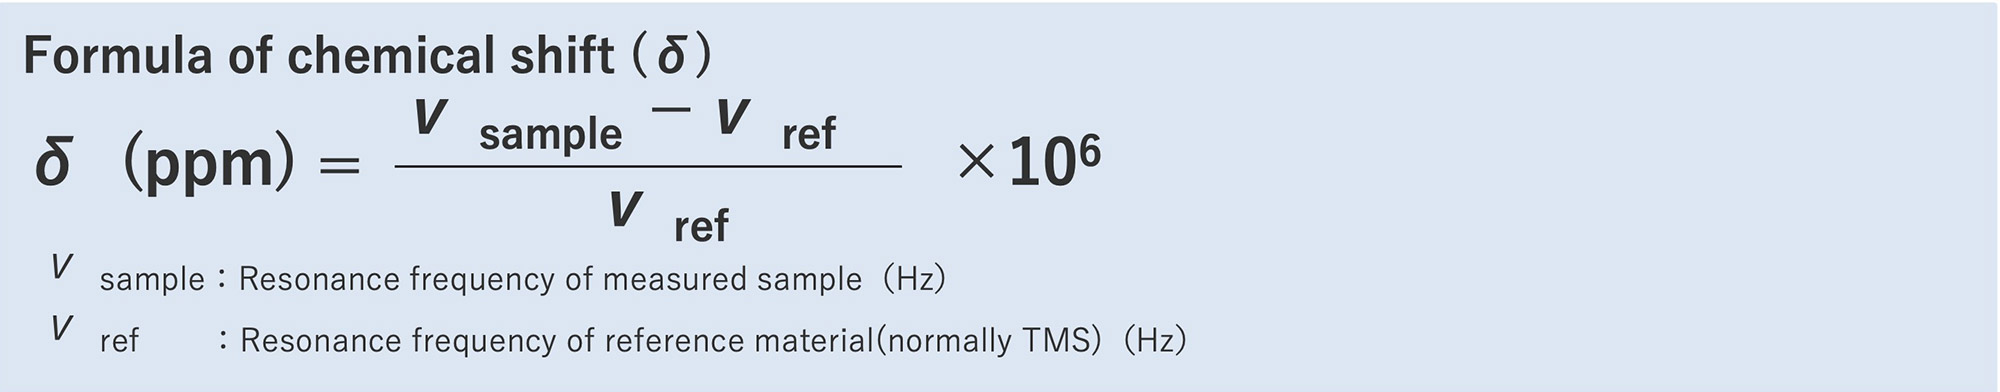
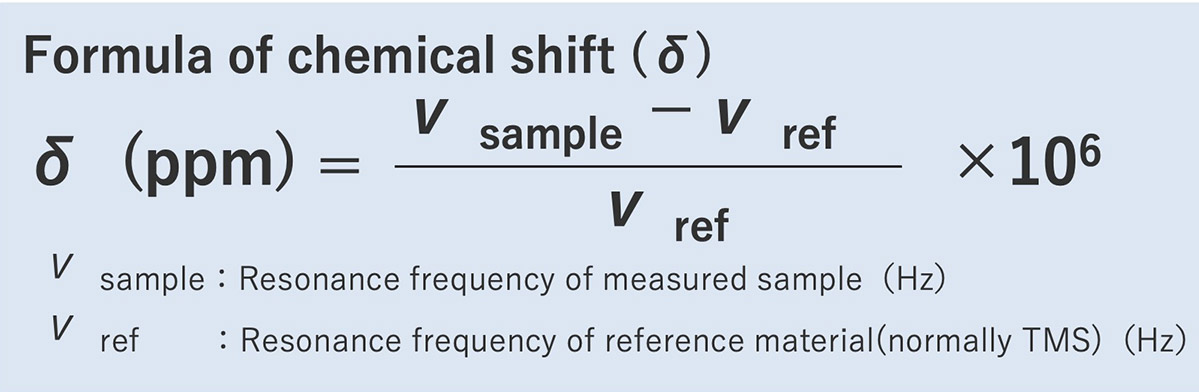
Figure 3 shows a correlation diagram of typical functional groups and 1HNMR signal positions. In
the NMR spectra, the right side is generally called as the high-field side and the left side as the
low-field side. The signal appearing at 0 ppm is the signal of the reference material TMS
(tetramethylsilane). The chemical shift value is a numerical value that represents the shift from other
signals) So, it is necessary to calibrate the reference point with a reference material such as TMS etc.
1H signals from alkyl chains, such as methyl, methylene, and methine, often appear near 1 ppm.
And as mentioned above, 1H signals near alcohol and ether groups with neighboring oxygen atoms
and 1H signals derived from amino groups with neighboring nitrogen atoms are detected near 3ppm
to 4ppm.
The signal appearing near 5 ppm is an alkene-derived 1H signal. Furthermore, 1H
signals derived from aromatic rings are observed around 7 ppm, and a signal derived from formyl groups such
as aldehydes appears around 9 ppm. Signals derived from carboxyl and phenol groups appear around 11 ppm. The
position at which the signal appears allows a rough prediction of the type of functional group.
When performing a structural analysis using NMR, please be careful of heavy water exchange in the case where
OH or COH groups are included.
In solution NMR, the sample is dissolved in a heavy solvent for measurement. If the solvent to be used is
heavy water or heavy methanol, heavy water exchange occurs between the D(2H) in the solvent
molecule and the
1H in the OH or COH groups, and the 1H signal from the OH or COH groups may not be
observed.
Integration ratio
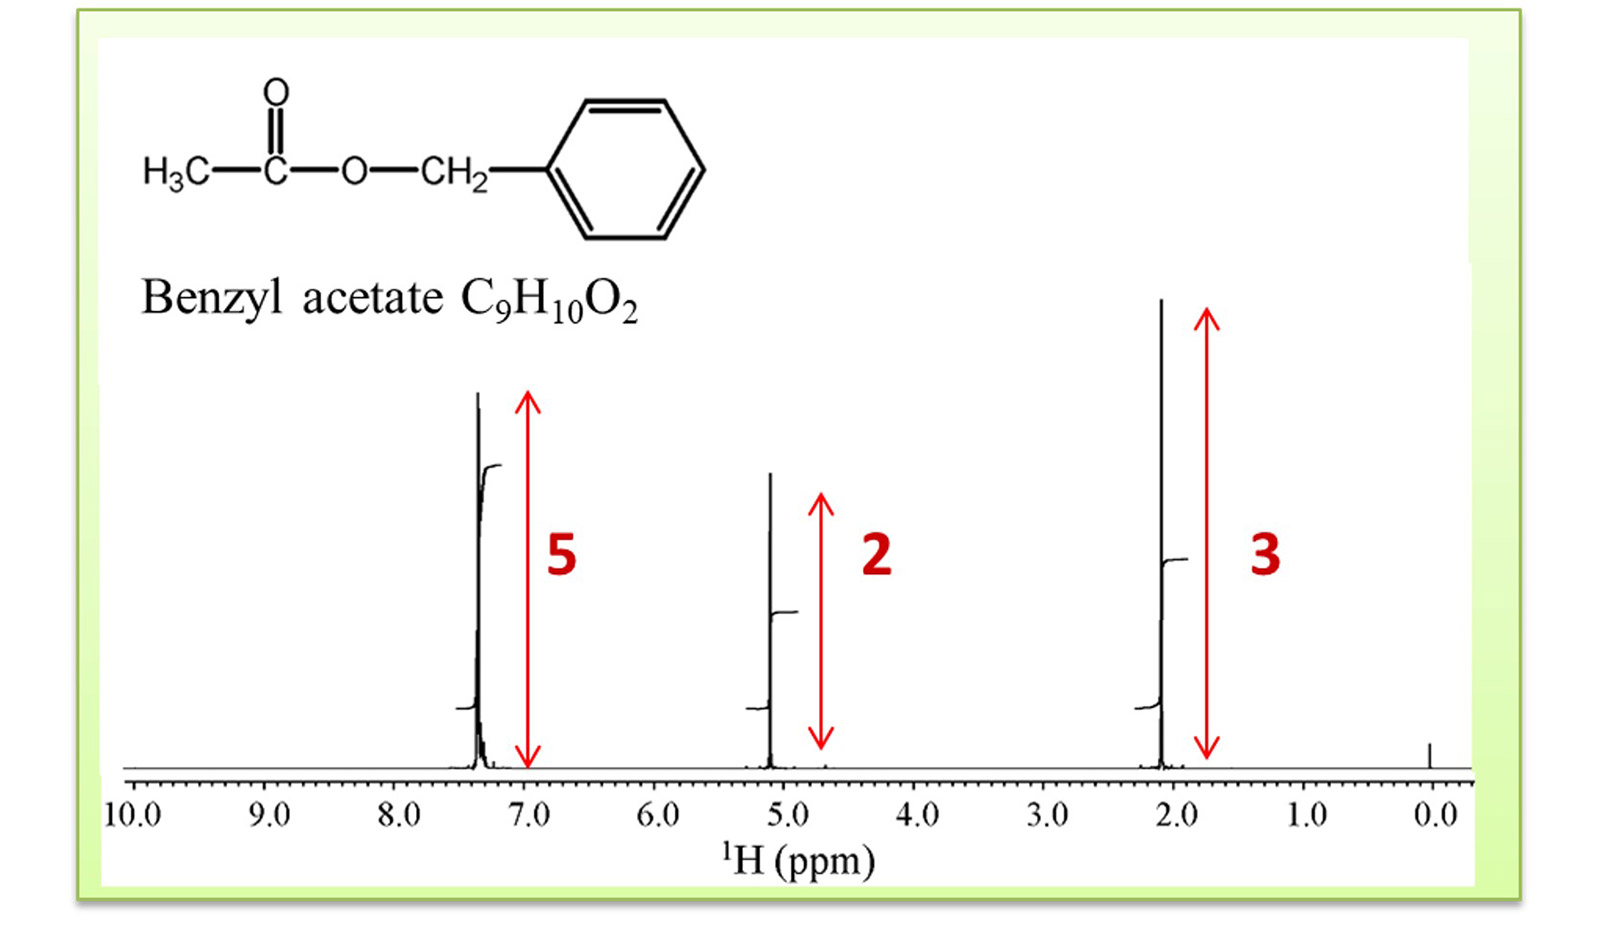
Fig.4 1HNMR spectrum of benzyl acetate
The following is a brief introduction to the use of integration ratios. Figure 4 shows the structural
formula of benzyl acetate and the 1H spectrum. Looking at the molecular structure of benzyl
acetate, we can guess that 1H signals would be observed in three areas related with the
CH3 group, the CH2 group, and the aromatic group.
Furthermore, a closer look reveals that benzyl acetate has three 1Hs derived from CH3,
two
1Hs derived from CH2, and five 1Hs derived from one substituted aromatic
CH. The
integration ratio of each signal is calculated to be CH3:CH2:CH = 3:2:5, which
indicates that the values
predicted from the structure and the actual measured values coincide.
It can also be seen that CH3 is shifted to the left from the area where 1H signal
derived from
CH3 is often observed (around 1 ppm) due to the influence of the neighboring O atoms.
Examples of the use of integration ratios in mixed samples include the following
- Relative quantitative evaluation by comparison of integration values of each component
- Absolute quantitative evaluation using a standard substance of known purity (q-NMR)
- Calculation of reaction rate by comparison of integration values before and after the reaction
In both examples, it is important to find the signal that is specific to each component and that can be integrated correctly (i.e., not overlapping with other signals).
Coupling and Spin-Spin Coupling Constant "J"
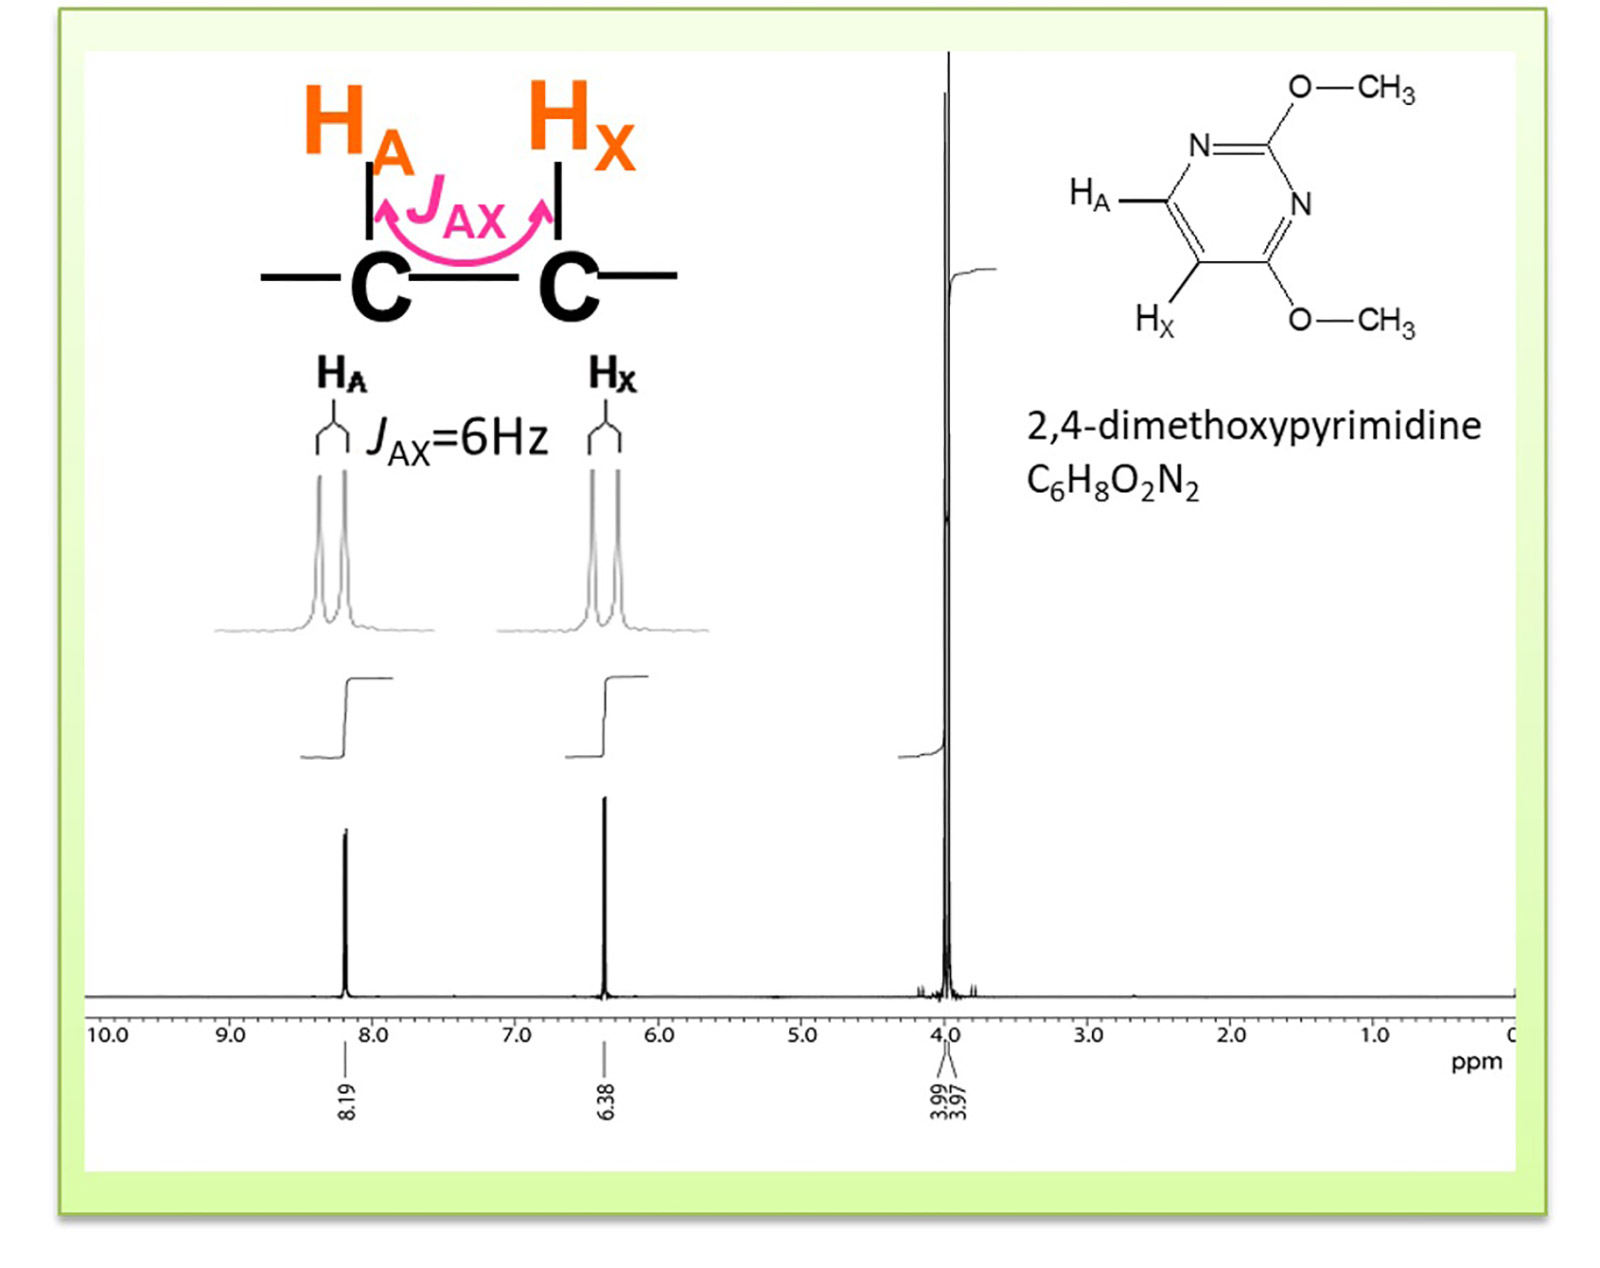
Fig.5 1H NMR spectrum of 2,4 dimethyl pyrimidine
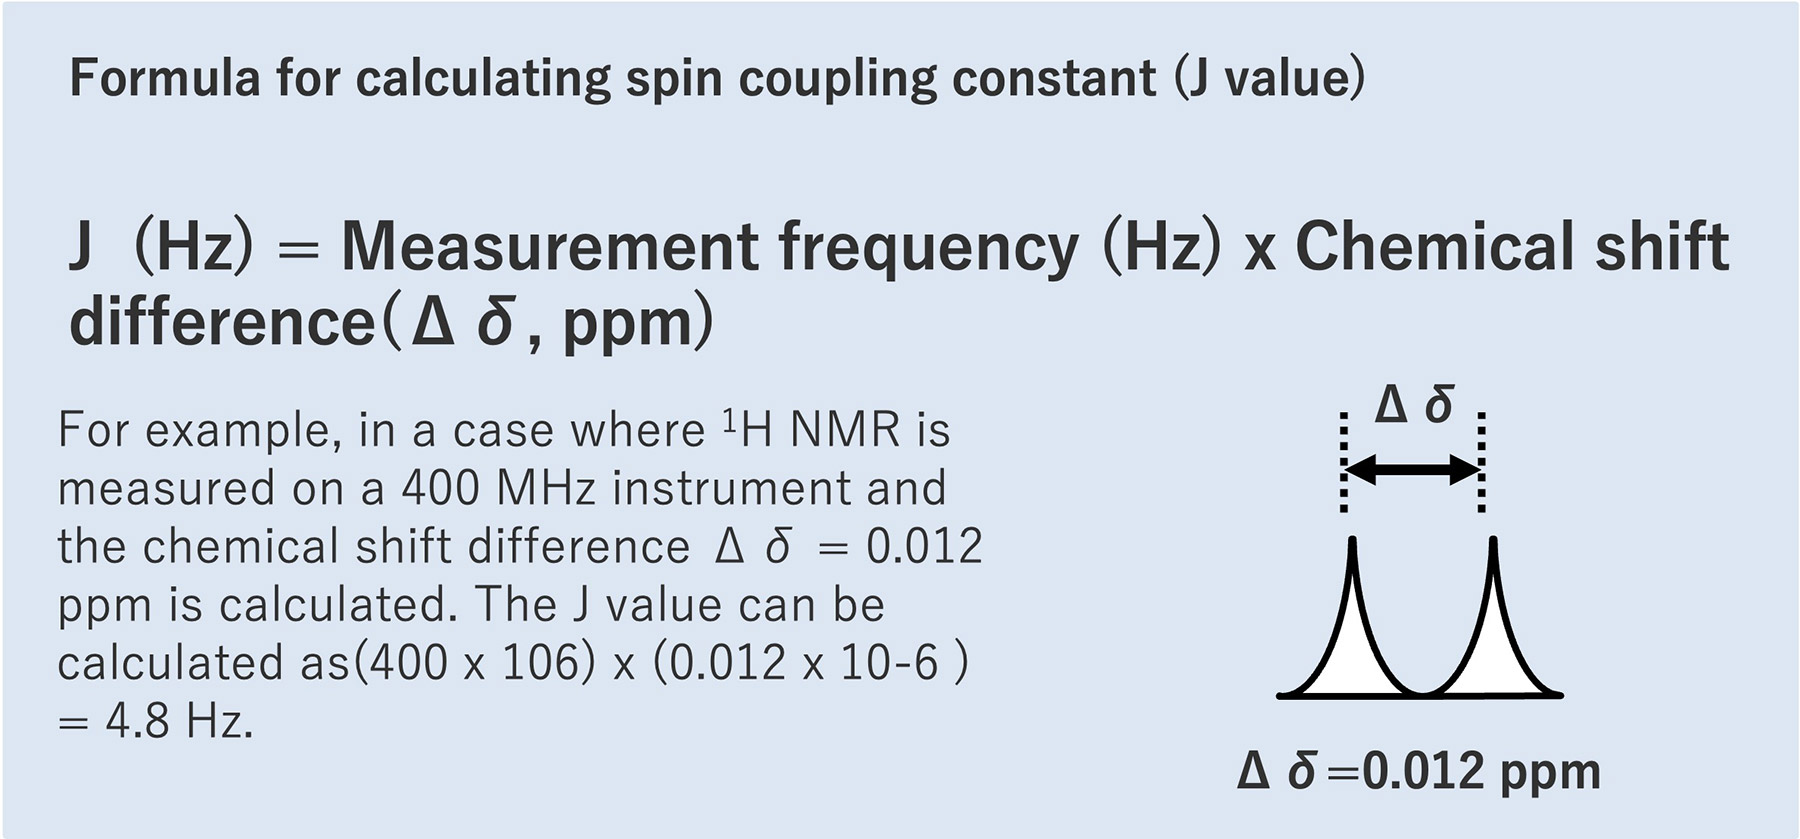
Finally, we introduce couplings. Coupling refers to the interaction between the nuclear spin of interest and another neighboring nuclear spin. In 1D measurements of 1H NMR, the interaction, "coupling" occurs when nuclear spins are in proximity to each other and induces the NMR signal splits. The unit of the splitting width of spin coupling is expressed in Hz. This number is called the spin coupling constant or J-coupling constant (j-value).
It is also known that the splitting widths have the same j-value when coupled to each other. In the compound in Fig. 5, Ha and Hx are coupled, so the splitting widths of both Ha and Hx have the same value, 6hz.Thus, when a split peak is observed, the j-value information can be used to determine which signals are coupled.
Splitting pattern due to coupling
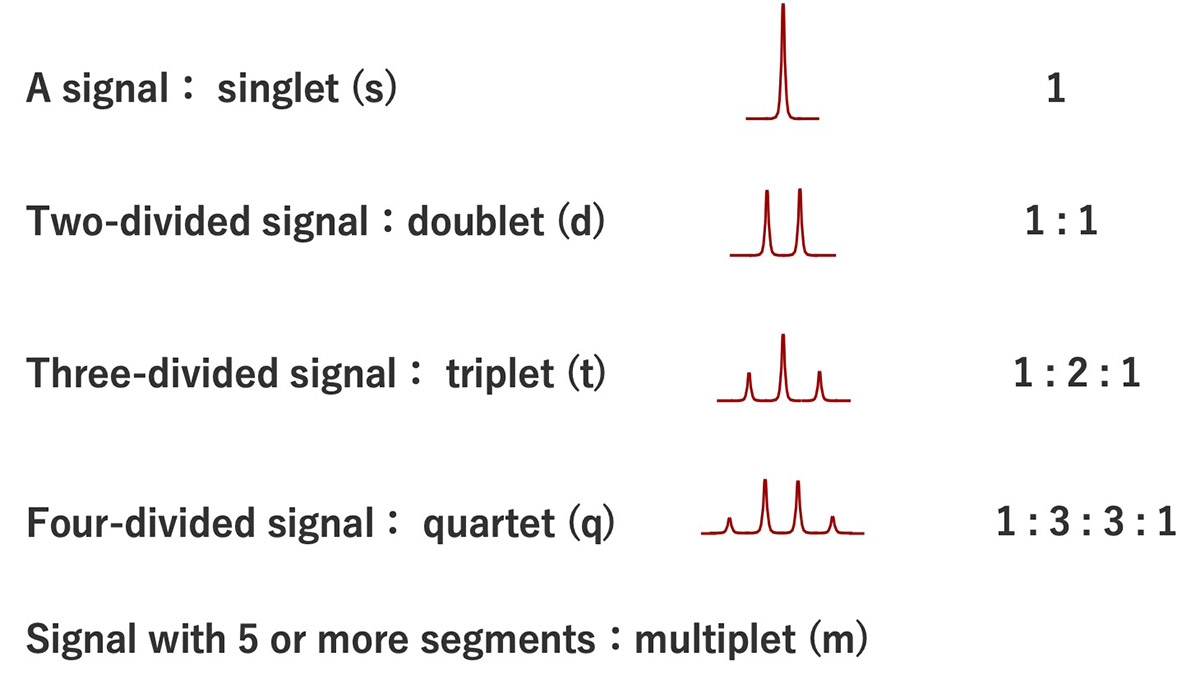
Let us explain a little more about the splitting pattern caused
by coupling. An
unsplit signal is called a singlet, denoted by the symbol "s"; a two-divided signal is a doublet, denoted by
the symbol "d"; a three-divided signal is a triplet, denoted by the symbol "t"; a triplet has a signal
strength ratio of 1:2:1, : A signal that splits into four is a quartet, denoted by the symbol "q." The
signal strength ratio for a quartet is 1:3:3:1. Signals with five or more segments are multiplets, indicated
by the symbol "m".
Using the 1H NMR spectrum of ethanol as an example, we will explain the splitting of the
1H signal. Focusing
on the signal derived from the CH3 group around 1ppm, the number of 1H near by
CH3 group is 2 (coupled with
CH2 group), so it splits into 2+1=3.
Looking at the signal derived from the CH2 group around 3.5 ppm, the number of 1H near by
CH2 group is 3
(coupled with CH3 group), which splits into 3+1=4.
Because the OH signal around 5ppm is not coupled to the near by 1H, it does not split and is in
the singlet
state. Basically, we can see that the signal splits into the "n+1", "n" means the number of nuclei spins
positioning around the nuclear spin of interest.
Products
Nuclear Magnetic Resonance Spectrometer (NMR)
NMR is the abbreviation for Nuclear Magnetic Resonance. It is an instrument used to observe the resonance phenomenon of nuclear spins by placing atomic nuclei in the magnetic field to analyze molecular structure of a substance at an atomic level. Specifically, it is useful in the analysis of organic compounds and polymer materials and used in the fields of pharmaceutical, biology, food, and chemistry. The application is even recently expanding to include the analysis of structural and physical properties of inorganic materials such as ceramics and batteries.

NMR Probes
With NMRs, the detector (probe) differs depending on the sample form and measurement technique. JEOL offers solution and solid probes for a wide variety of purposes.
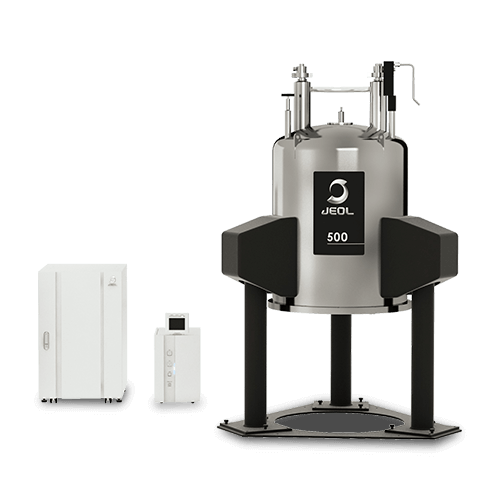
NMR Magnets
Space-saving design with a compact superconducting magnet.
Greater
flexibility of installation layout of the instrument is possible with the new compact magnets that have
a smaller stray magnetic field.
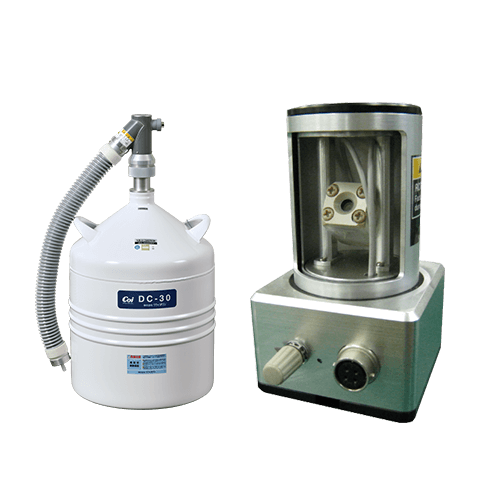
NMR Peripherals
Introducing NMR peripherals such as the Auto Sample Changer and Nitrogen Replenishment System.

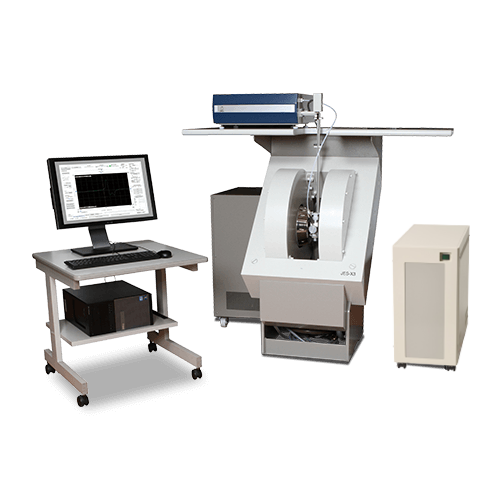
Electron Spin Resonance Spectrometer (ESR)
Electron Spin Resonance (ESR) is a powerful analytical method to detect, analyze and determine thecharacteristics of unpaired electrons in a substance. It is clear that the state of electrons in a substance have a strong influence on its characteristics and functionality, so evaluation by ESR is becoming more and more important. Many types of substances, from electronic materials to catalysts, biological samples, can be studied regardless of whether they are solid, liquid, or gas. A wide range of ESR techniques are possible using suitable attachments together with the basic instrument.
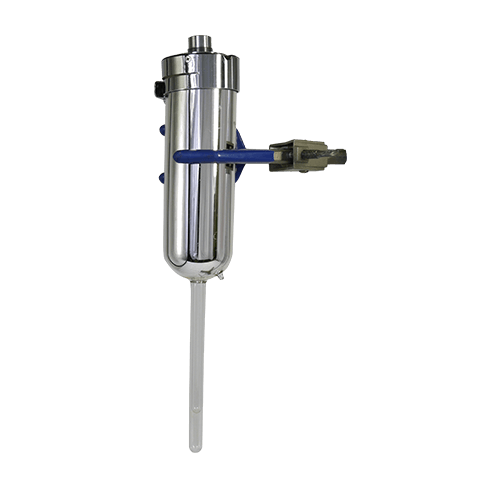
ESR Peripheral Equipment
We have ESR attachments and consumables that can make a versatile measurement possible.
JEOL Ltd.
Since its foundation in 1949, JEOL has been committed to the development
of cutting-edge scientific and metrology instruments, industrial and medical equipment.
Today,
many of our products are used throughout the world and we are highly regarded as a truly global
company.
Aiming to be a 'top niche company that supports science and technology around the
world', we will continue to respond precisely to the increasingly sophisticated and diverse needs
of our customers.