


Soy Meat Aroma Components Analysis Using Microchamber and Thermal Desorption GC-MS
MSTips No. 504
1. Introduction
One of the challenges of plant-based meat alternatives is replicating the flavor of animal-based meat, and aroma plays a significant role in that flavor. In particular, the reduction of the beany odor is a challenge in soy-based meat products, and it is important to identify the trace compounds responsible for this odor in the aroma components of the samples. The microchamber/heated extraction device is used to collect volatile organic compounds from samples heated in the chamber by a sample tube containing adsorbent. Samples can be placed directly into the chamber and a wide range of sample volumes can be set. Thermal Desorption (TD) is a pretreatment device that heats the sample tube and introduces the desorbed gas into the GC. The gas desorbed from the sample tube is trapped in a cooled focusing trap and then desorbed by rapid heating of the focusing trap. The two-stage thermal desorption system provides high analytical sensitivity. These methods are used in a wide range of fields such as food, fibers, plastics and wood products because of their ability to collect volatile compounds efficiently (MSTips No.435, 436, 459). In this report, we show the useful analysis results of soy meat aroma compounds using this method.
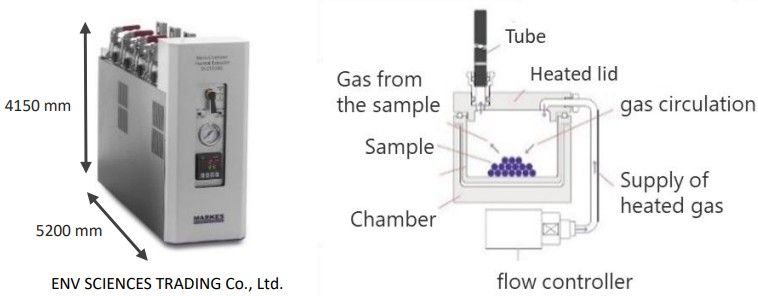
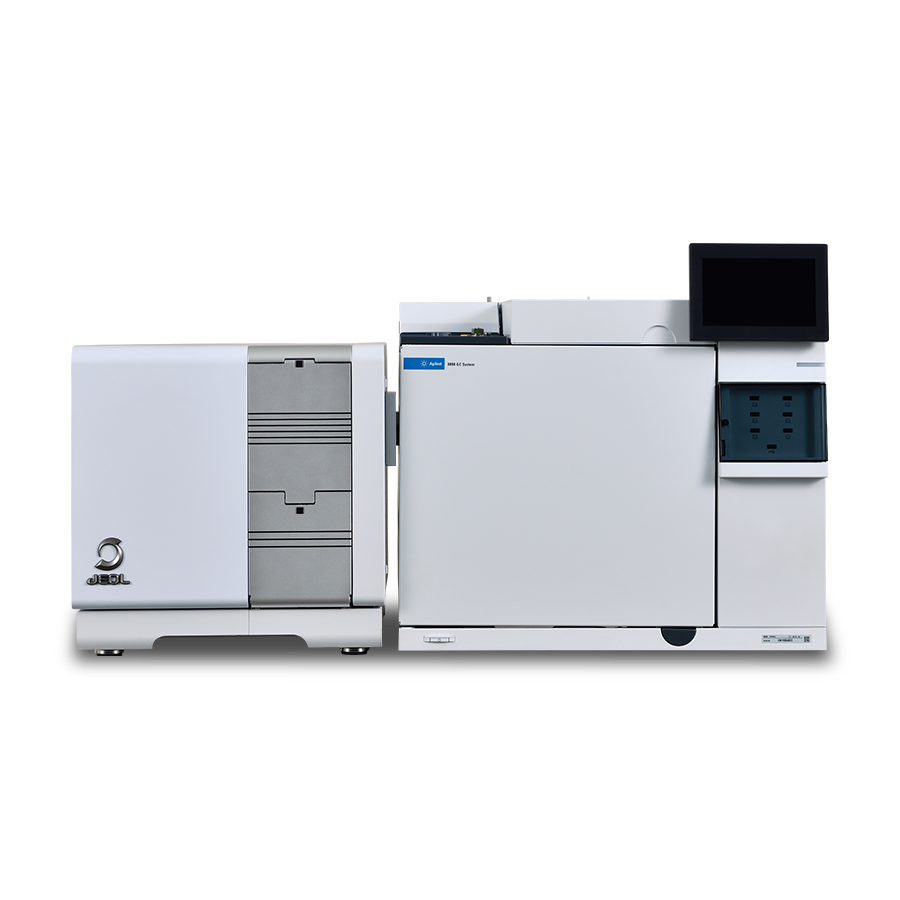
µ-CTE250
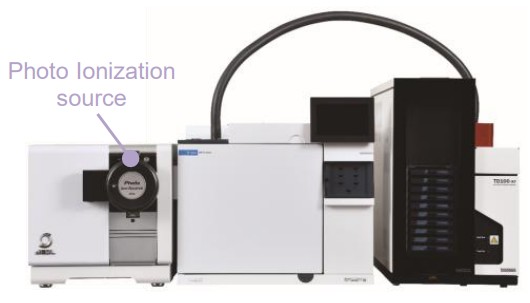
TD100-Xr,
JMS-Q1600GC UltraQuad™ SQ-Zeta
2. Experiment
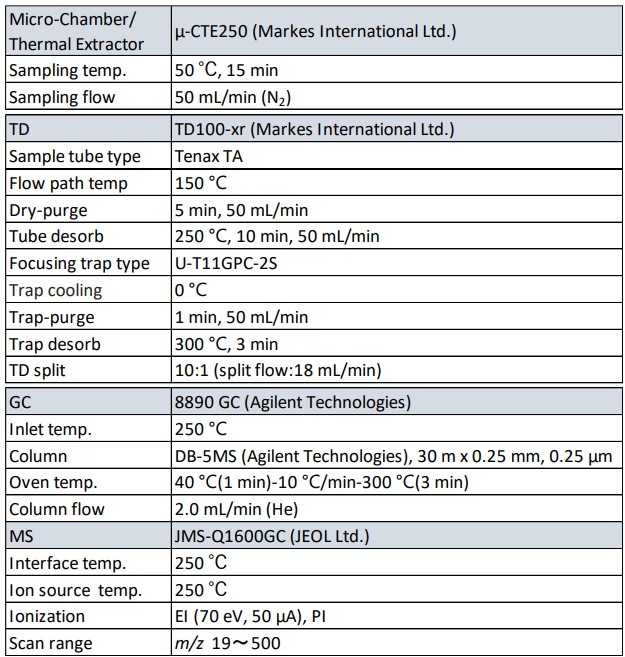
Figure 1 shows the collection method using the microchamber. A commercial soy meat products (hamburger steak) weighing 10 g was used as the sample. The sample including all ingredients (bun, patty, sauces, pickles) on aluminum foil was placed in the microchamber (µ-CTE250, MARKES International Ltd.). The temperature of the chamber was set at 50 ℃, and Volatile compounds were collected by passing through the sample tube for 15 minutes. The measurement was performed using a GC-MS (JMS-Q1600GC, JEOL Ltd.) attached to a TD pre-treatment device (TD-Xr100, MARKES International Ltd.). The ionization methods used were electron ionization (EI) and photoionization (PI) as soft ionization (SI). The analysis of the obtained data was performed using the software "Integrated Qualitative Analysis1) " (hereafter referred to as msFineAnalysis iQ) from JEOL Ltd. The measurement conditions are shown in Table 1.
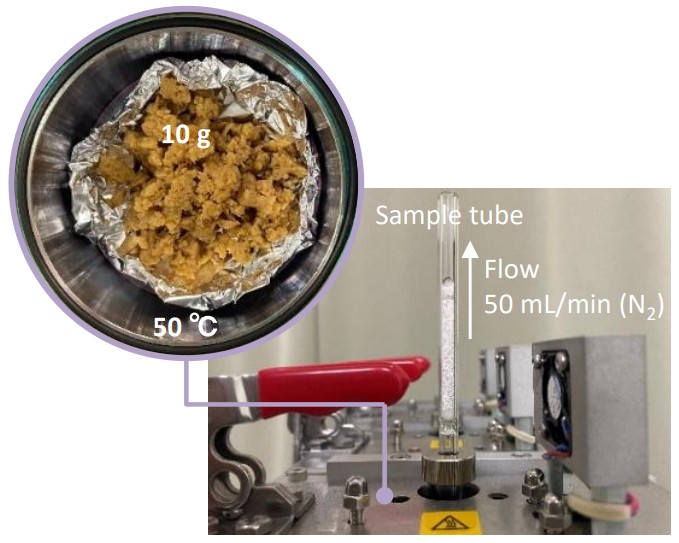
Figure 1 Sampling process
Table 1 Measurement Condition
3. Results
3.1 TICC and Deconvolution peaks
The TICC and deconvolution peaks from the TD-GC-MS measurement are shown in Figure 2. The deconvolution detection function of msFineAnalysis iQ can identify multiple components in a peak that appears to be a single component, as well as small amounts of components that cannot be detected in the TICC. This function detected Top 50 peaks (ID:[001]-[050]) based on relative intensity. These peaks were compounds originating from hamburger steak such as dimethyl disulfide from onion, hexanal from soy, 4-terpineol from nutmeg (basic seasonings of a hamburger steak) and so on. Therefore, it was shown that TD-GC-MS enables the analysis of aroma components in food.
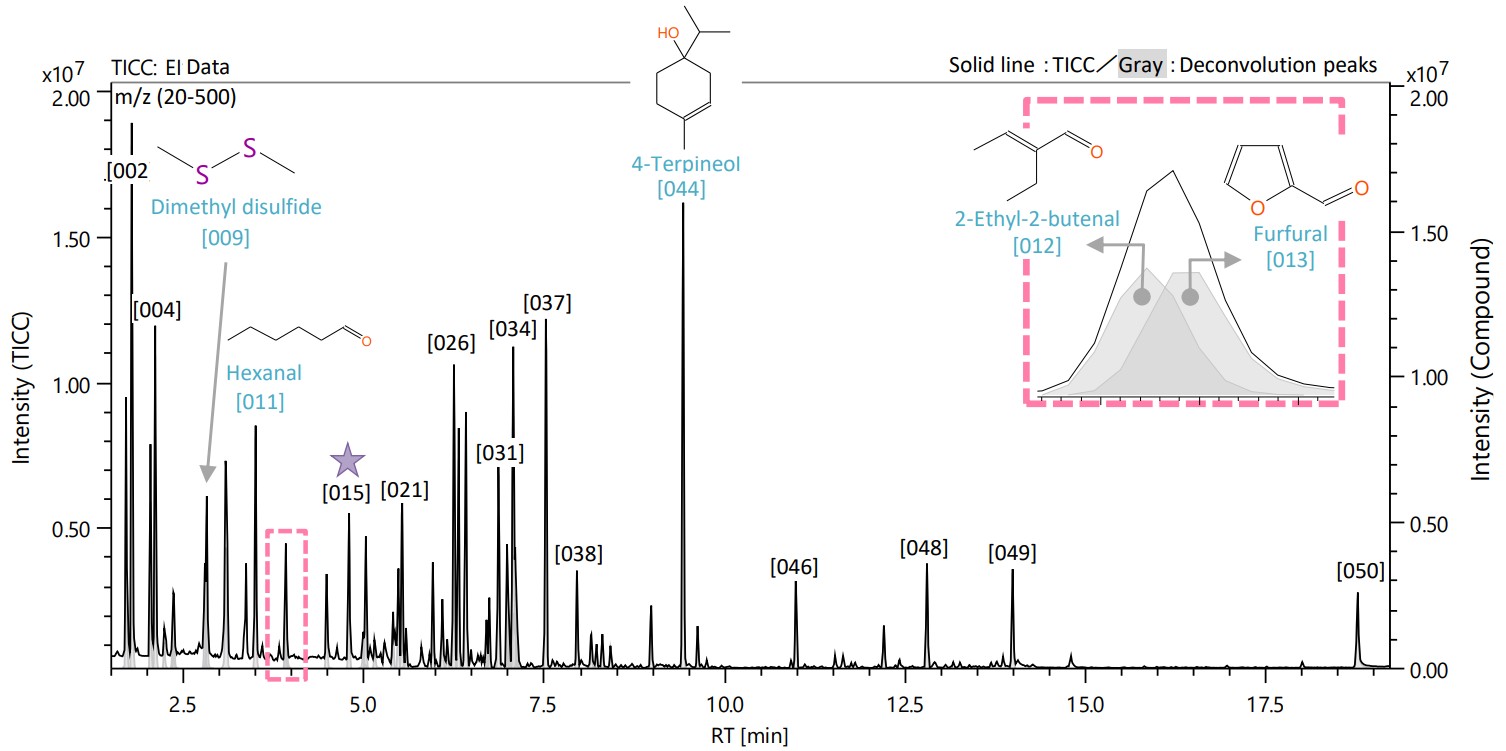
Figure 2 TIC chromatogram and Deconvolution peaks
3.2 Results of msFineAnalysis iQ
Table 2 shows the integrated analysis results of 50 peaks (ID:[001]~[050]) obtained using msFineAnalysis iQ. The msFineAnalysis iQ“ provides high quality results through integrated qualitative analysis using identification functions such as confirmation of molecular ions in EI and SI data, retention index (RI) and isotope ratio matching in addition to database searching of EI data. For example, peak [015] ★ was identified as 2-heptanone based on the integrated analysis. Figure 3 shows the mass spectrum. The mass spectrum similarity (Match factor : Max 999)is 969, indicating a good result. Molecular ion peaks were detected in the mass spectra from both EI and PI data, and it was detected as the base peak in the PI data. Furthermore, the isotopic pattern analysis results shown in Figure 4 indicate that the similarity score between the measured and theoretical values is 0.99, indicating a good result. And the difference between the measured RI value of this peak and RI value in the database (ΔRI<30 is good) is 6 [iu], indicating a good result. As a result, several aroma components suspected to be from hamburger steak were confirmed with high accuracy.
Table 2 msFineAnalysis iQ results (ID:[001]~[015])
The background color of the table ・・・Blue : highly accurate result.
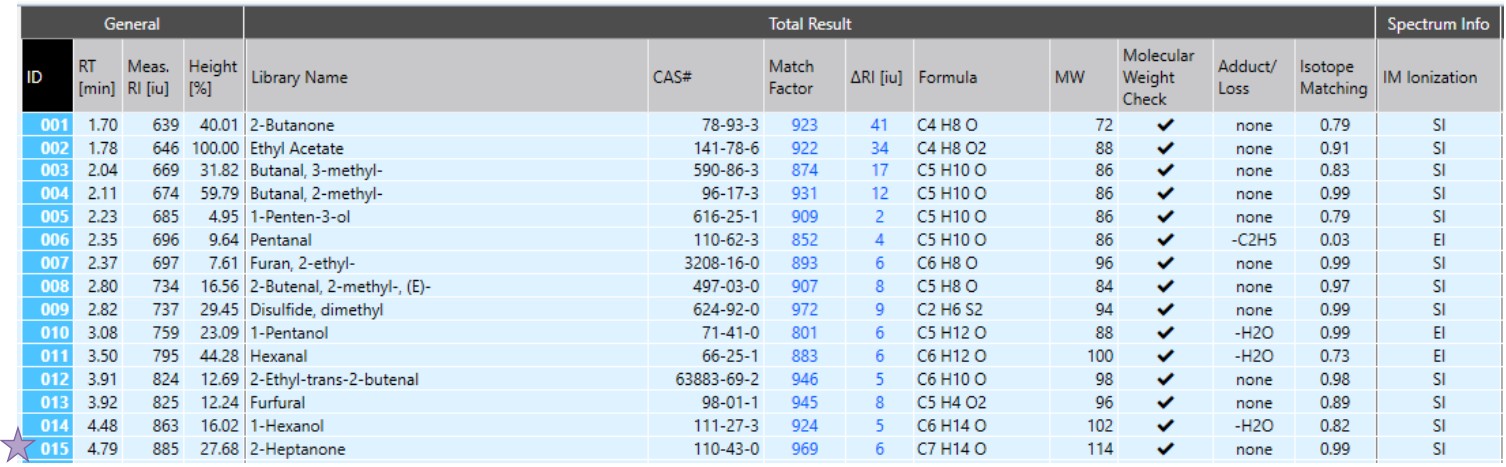
Table 2 msFineAnalysis iQ results (ID:[016]~[050])
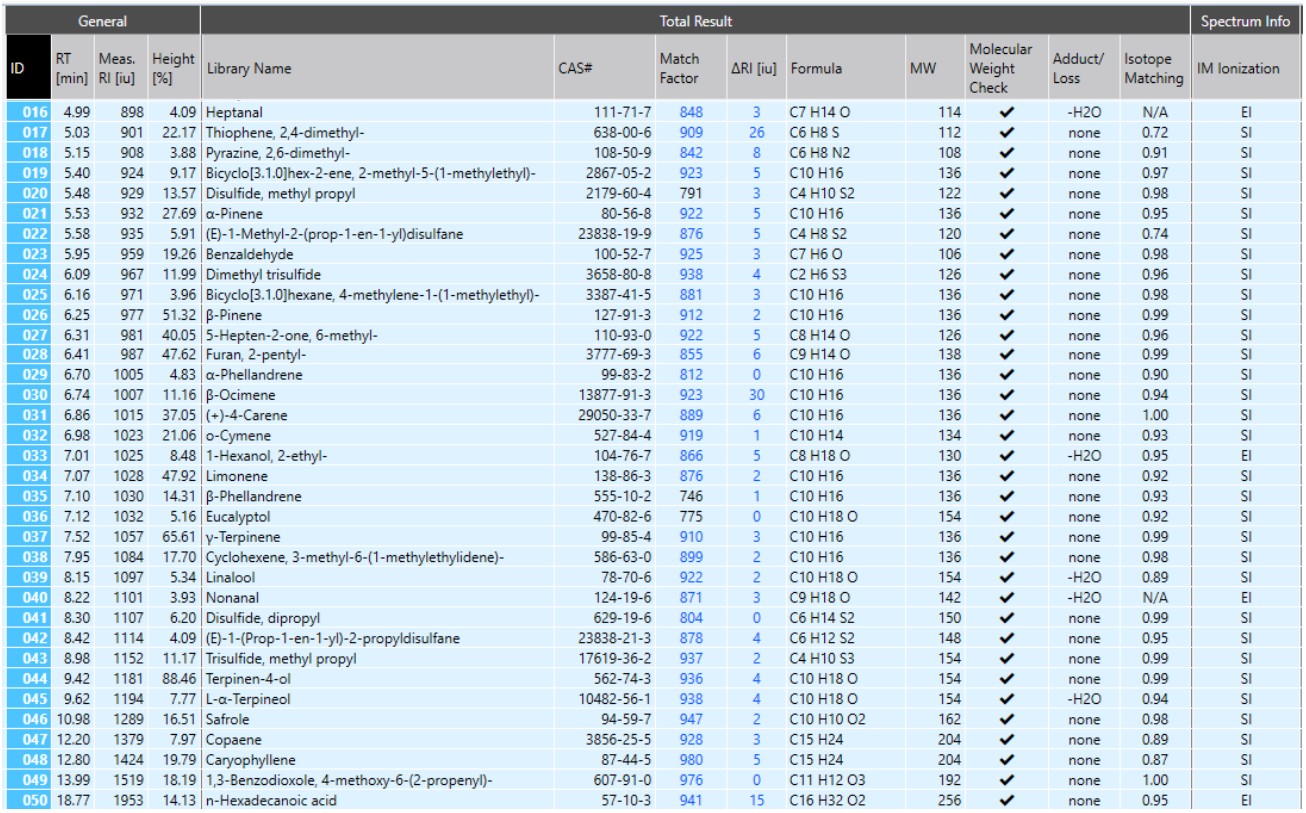
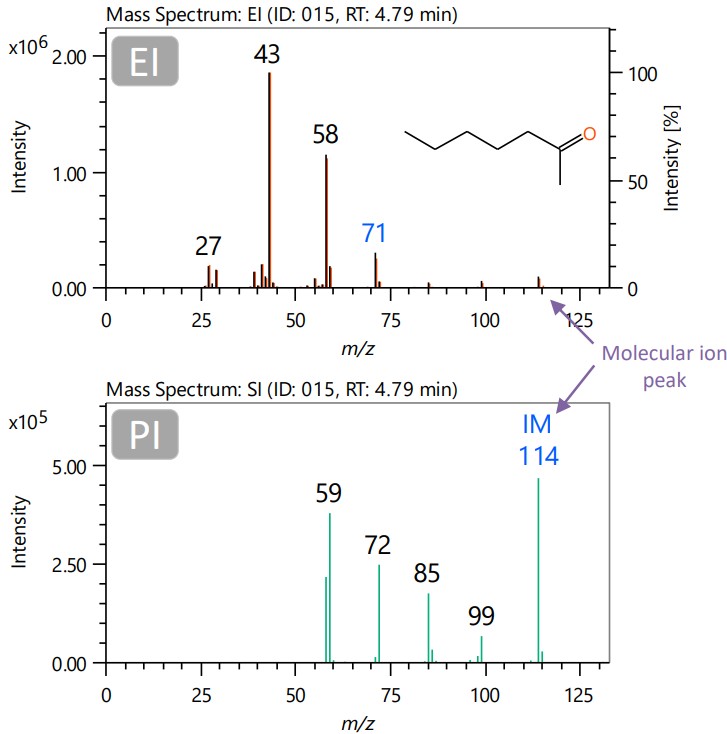
Figure 3 Mass spectra of ID:[015]
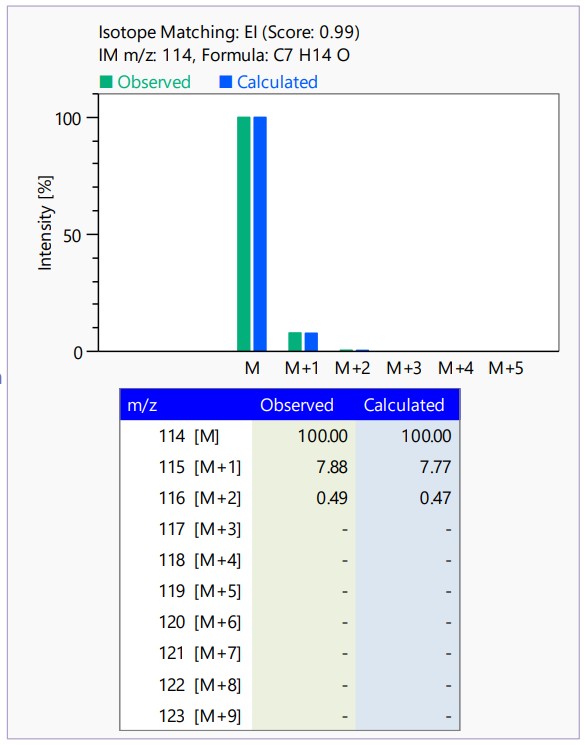
Figure 4 Isotope pattern matching results for ID:[015] molecular ion
4. Conclusion
We analyzed the aroma compounds in hamburger steak using microchamber and TD-GC-MS. As a result, several aroma compounds were identified from the hamburger steak, demonstrating the usefulness of this method for food aroma analysis.
References
1) M. Ubukata et al, Rapid Commun Mass Spectrum., 34 (2020). DOI: 10.1002/rcm.8820
Solutions by field
Related products
Related information


Are you a medical professional or personnel engaged in medical care?
No
Please be reminded that these pages are not intended to provide the general public with information about the products.