Energy Dispersive Fluorescent X-ray Spectrometer
For elemental analysis in a wide range of fields!
The energy dispersive fluorescent X-ray spectrometer is utilized in a very wide range of fields as “instruments that enable anyone to carry out elemental analysis”. This wide applicability is due to its versatility; providing analysis of samples in various forms, including solids, powders, liquids, and thin films with easy pre-treatment (sampling), and of executing quantitative analysis without a standard sample.
Interactions between Material and the Fluorescent X-ray Spectrometry
X-ray is a kind of electromagnetic wave, the same as light. The wavelength of visible light is 400 to 800nm, while the wavelength of x-ray is much shorter (higher energy), at 0.001nm to 10nm, and is known to have strong penetrating power.
Fig. 1 shows the interactions between a material and X-ray, and various analysis methods that make use of these interactions. These interactions provide important clues for learning the state of a material. As a familiar example, an X-ray image for medical application is a well-known use of transmission X-ray. Here we will introduce an elemental analysis method called fluorescent X-ray spectrometry.
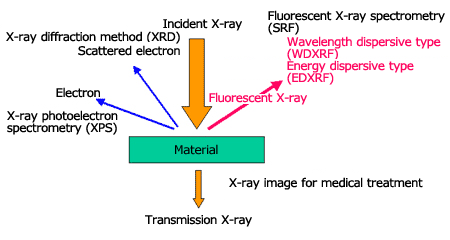
Fig.1 Analytical methods and its application interaction of X-ray and matter
Fluorescent X-ray Spectrometry
When irradiating X-rays onto a material, fluorescent X-ray (characteristic X-ray), which has energy (wavelength) unique to the element that composes the material will be generated. When we measure the fluorescent X-ray energy, the contained element is identified (qualitative analysis), and we can calculate the concentration (quantitative analysis) from the intensity of the fluorescent X-ray of each element. Thus, the qualitative or quantitative analyses of a material by irradiating X-rays onto an unknown material and analyzing the fluorescent X-ray that is generated, is called fluorescent X-ray spectrometry.
There are two types of fluorescent X-ray spectrometry; the wavelength dispersive type (WDXRF) using analyzing crystals, and the energy dispersive type (EDXRF) using semiconductor detectors (EDS).
Comparison between Energy Dispersive Type and Wavelength Dispersive Type Spectrometers
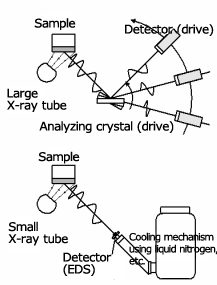
The characteristics of a wavelength dispersive type spectrometer (WDXRF) are high sensitivity, high accuracy, high resolution, and high reproducibility. We can expect sensitivity and accuracy at levels one order of magnitude higher than those of the energy dispersive type spectrometer (EDXRF). These characteristics are provided by a high-power X-ray tube (3 to 4 kW) and its cooling device, a goniometer which makes complicated movements and an exchange mechanism for the analyzing crystal and detector and so on. Naturally, the instruments are larger, with a complicated structure and high price. The specimen surface is required to be flat and the available analysis area is from several mm to 30mm or so. This type of device is suitable for process management where specimens with the same form are analyzed one after another.
The characteristics of the energy dispersive type spectrometer (EDXRF) are simple structure and low price, its adaptability to a variety of specimens, and its user-friendliness. The X-ray bulb is compact (several tens W) and air-cooled, and since the EDS (semiconductor detector) itself performs the analysis, a complicated spectroscopy section is not necessary.
The roughness or shape of specimen does not matter, so analysis of large specimens or micro areas is possible. Each characteristic is shown in Fig. 2. The images are the large instrument for WDXRF, and the compact simple instrument for EDXRF.
Wavelength Dispersive Type (WDXRF)
Advantages: High Sensitivity, High Resolution
High Accuracy, High Reproducibility
Disadvantages: Complicated and large-sized, high price
Specimen is limited to flat plates
Energy Dispersive Type (EDXRF)
Advantages: Simple Operation, compact, low price
Flexibility in specimen shape
Disadvantages: Low resolution (overlapped peaks)
Cooling mechanism requiring liquid nitrogen or the like
Fig.2 Comparison between Wavelength Dispersive Type (WDXRF) and Energy Dispersive Type (EDXRF)
Sampling of Solid/Powder/Liquid Samples
One of the characteristics of EDXRF is the ease of use. Sampling of solid, powder, and liquid samples is explained below.
Sampling of Solid Sample
Analysis of a solid sample is possible by simply placing the sample at the X-ray illumination position.
In case of small sample, use of a dedicated cell will make it easier to set the sample. Fig. 3 shows a simplified illustration of the solid sample sampling method.
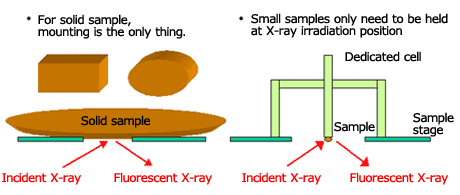
Fig.3 Sampling of Solid Sample
Sampling of Powder Sample (rock, soil, incinerated ash, etc)
Powder samples are typically analyzed by producing a pellet using a compression device. As a simplified method, analysis is possible on the powder placed into a specially-designed cell. Fig. 4 shows a simplified illustration of the powder sample sampling method.
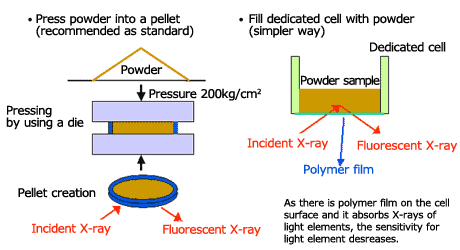
Fig.4 Sampling of Powder Sample
Sampling of Liquid Sample
For liquid samples, a dedicated cell is used. Fill a dedicated cell with the liquid and analyze. In addition, there is another method where you can drop liquid onto a filter, dry it, and then analyze it. Fig. 5 shows a simplified illustration of liquid sample sampling methods.
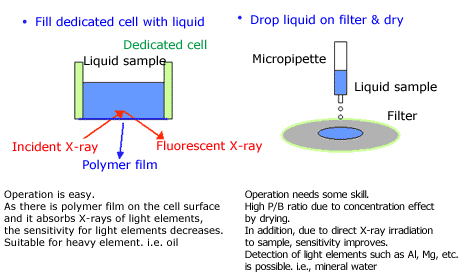
Fig.5 Sampling of Liquid Sample
FP Quantitative Method / Film Thickness Analysis of Thin Film Sample
FP (fundamental parameter) quantitative method
The EDXRF instrument employs a theoretical calculation method called the FP quantitative method, allowing quantitative analysis of an unknown sample without the need for a standard sample.
The FP quantitative method assumes that the sample is uniform, sufficiently large and thick, and that all elements (100% in total) are quantified. Naturally, a sample must satisfy these assumptions, so attention is needed.The flow chart of FP quantitative method is shown in Fig. 6.
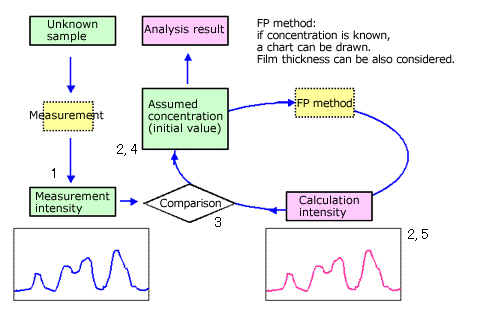
Fig.6 The flow chart of FP quantitative method
Flow Chart Explanation
First, measure the unknown sample and obtain the measurement intensity.
Assume the initial concentration of the sample and obtain a calculated intensity using the FP method.
Compare the measurement intensity and the calculated intensity.
Change the assumed concentration so that the measurement intensity and the calculated intensity match.
Obtain a new calculated intensity with the new assumed concentration using the FP method.
Repeat steps 3 to 5.
The assumed concentration that gives a calculated concentration that matches the measurement concentration is the analysis result.
Film Thickness Analysis of Thin Film Sample
In the case of a thin film sample, there is a correlation between the x-ray intensity of the elements composing the film and the film thickness. Therefore, by irradiating X-rays onto the surface of a thin film and measuring the X-ray intensity of the elements composing the film, the film thickness can be analyzed without destroying it.
A Single layer film can be analyzed using a calibration curve, but with the calibration curve method, a standard sample must be prepared for each kind of film. When the thin film FP quantitative method is used, it is not only possible to analyze single layer films, but also to analyze the thickness and composition of each layer in a multi-layer thin film, up to 5 layers , without a standard sample, which is very convenient. Fig. 7 shows a diagram of the thin film FP method, Fig. 8 shows a measurement example of Au/Ni/Cu film.
Thin Film FP (fundamental parameter) method
Simultaneous non-destructive analysis of thickness and composition of thin film
Up to 5 layers, and up to 20 elements for each layer
Film thickness of about 10nm to 10μm (differs depending on element)
Standard sample is not necessary (theoretical calculation)
Information of layering order, elements, and density of the film is needed.
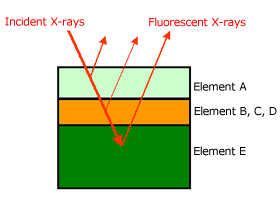
Fig.7 Schematic diagram of a thin film FP method
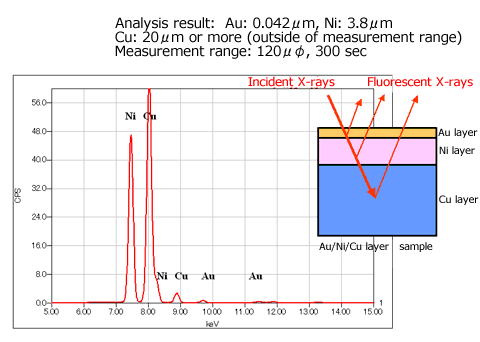
Fig.8 Measurement of the film Au / Ni / Cu thin film FP method