Electron Probe Micro Analyzer
Electron Probe Micro Analyzer
All-purpose surface analysis instrument from electron image observation to elemental analysis and structure analysis of small areas
The Electron Probe Micro Analyzer (hereinafter, “EPMA”) is an instrument to analyze which elements compose a substance, by irradiating electron beams onto the substance surface and measuring the characteristic X-ray that is generated.
EPMA was devised and presented by Dr. Castaing of France in his academic dissertation in 1951. EPMA today is playing an active role worldwide, as an all-purpose, multi-functional tool equipped with electron optics technology, X-ray spectrometry technology, system control and data processing technology. EPMA has evolved into an instrument that can handle elemental analysis of sub-micron areas as well as observation, analysis, and image analysis for areas as large as 10cm square.
This instrument is used for basic research in a diverse range of fields, such as steel, minerals, semiconductors, ceramics, textiles, medical and dental materials, medicine, and biology, as well as for application research and product quality management.
Mechanism of the instrument
What is the structure of EPMA?
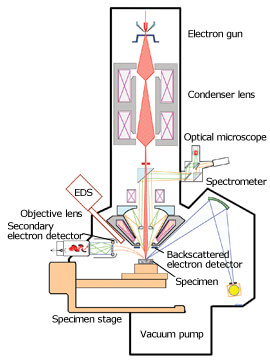
The figure at the right shows the structure of an EPMA device.
Electrons emitted from the electron source are accelerated at a certain accelerating voltage and collimated through electron lenses. When this electron beam hits a specimen, X-rays are generated from the specimen. By dispersing this X-ray using a dispersive element, the composition of the specimen can be examined. This type of spectrometer is called a wavelength dispersive X-ray spectrometer (WDS).
What signals should be measured?
When accelerated electrons hit a specimen, in addition to the X-rays, particles and electromagnetic waves carrying various kinds of information are emitted. With EPMA, signals such as the characteristic-X-rays, secondary electrons, backscattered electrons, etc. are detected by the appropriate detectors and that information is utilized to find the area of interest on a specimen, and for analysis.
What is the difference between WDS and EDS spectrometry?
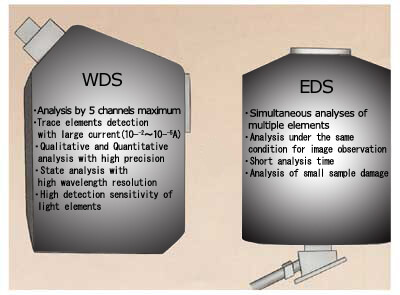
In addition to WDS, another spectrometry method for analyzing the characteristic X-rays is energy dispersive X-ray spectrometry (EDS). There are differences between WDS and EDS due to the differences in the spectrometry method, as shown in the figure at the left.
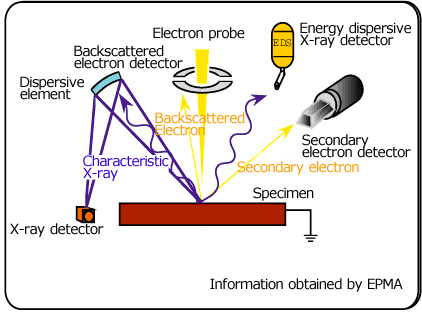
X-ray Generation and the Detection Principle
What is the mechanism of characteristic X-ray generation?
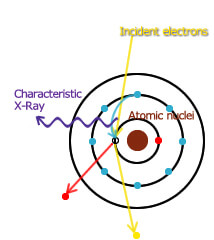
The model at the right shows how characteristic X-rays are generated.
Accelerated electrons kick out an electron around an atomic nucleus. An electron from an outer shell at a higher energy level comes down to take the place of the ejected electron. This movement between energy levels is accompanied by the emission of an X-ray with a wavelength that is equivalent to the energy difference.
Since the energy level of an element is unique to the element, by investigating the wavelength of the X-ray emitted, or the energy, it is possible to identify which elements compose the substance being examined.
What is Bragg diffraction?
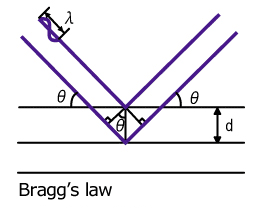
When X-ray is reflected (diffracted) by a dispersive element, only the X-ray which has a wavelength satisfying “Bragg’s law nλ=2dsinθ” is reflected. Wavelength dispersive X-ray Spectrometer (WDS) measures the wavelengths of X-rays by making use of this characteristic.
What is a Wavelength Dispersive X-ray Spectrometer?
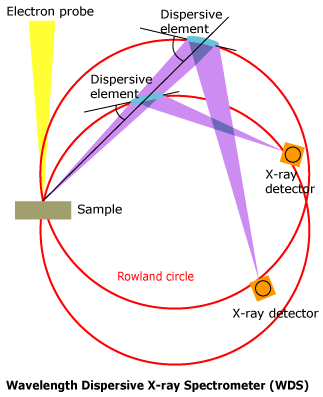
A wavelength dispersive X-ray spectrometer is constructed so that the specimen surface, analyzing crystal, and x-ray detector are positioned on a circle called the Rowland Circle, in order to satisfy Bragg’s law. Since a single analyzing crystal cannot be used to analyze all elements, normally, there are several diffraction elements incorporated into one instrument.
Analysis Example of EPMA
What is image observation (secondary electron image and backscattered electron image)?
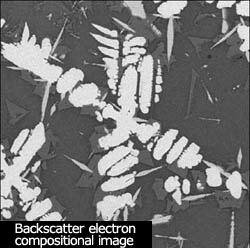
The first step of analysis is to identify the area of interest. Secondary electron images and backscattered electron images are very useful for this.
Especially, a backscattered electron image can reveal a rough compositional distribution, so it is very convenient for EPMA analysis. In a backscattered electron composite image, an area with a large amount of signal is bright, indicating that the area is composed of an element with a larger atomic number than the elements in the darker areas.
What can we learn from the qualitative analysis?
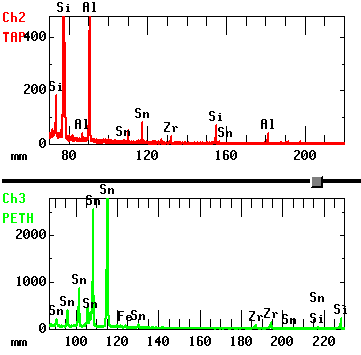
This example is the result of a qualitative analysis of a ceramic material (what elements are present). From the detected X-ray wavelengths it is possible to clarify which elements are present. In this case, we can see that Al, Si, Fe, Zr, and Sn are contained.
What is area analysis?
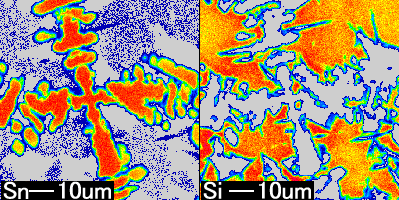
This shows the result of area analysis (where is each element distributed?) for Sn, and Si, which were detected in the preceding qualitative analysis. In area analysis, the more concentrated the red color on the color bar is, the more concentrated the element being analyzed is. It is clear that there is a difference in distribution concentration between Sn and Si.