JMS-S3000 SpiralTOF™-plus 2.0
Mass Spectrometry Imaging System
Features
◆Click the play button in the above box to watch the video. (2 min.)◆
Applications shown in the movie:
Distribution of lipids (phospholipids and fatty acids) in thyroid cancer tissues
Mass spectrometry imaging on mixed conductive/non-conductive substrate using JMS-S3000 SpiralTOF™
Other mass spectrometry imaging applications are here.
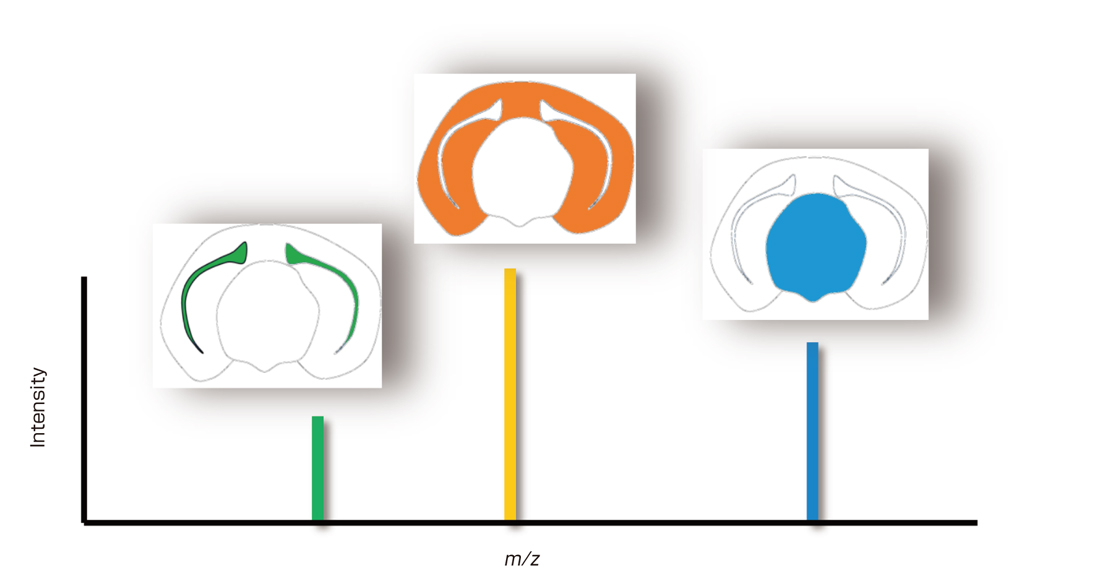
Why high mass-resolving power is required for MS imaging?
MALDI MS imaging was initially developed to focus on high molecular weight compounds such as proteins and peptides. However, with the expanding applications of MALDI MS imaging, the interests have shifted to include smaller molecules such as lipids, pharmaceuticals, and pharmaceutical metabolites. Conventional MALDI-reflectron TOFMS has difficulty discerning small molecule signals from those of matrix. In the case of MALDI MS imaging, signals from unwanted molecules on the specimen surface will often interfere with signals from the target analytes. High selectivity by means of high mass-resolving power is essential for obtaining reliable target analyte spatial distributions.
The SpiralTOF™-plus with its high mass-resolving power is indispensable for MALDI MS imaging.
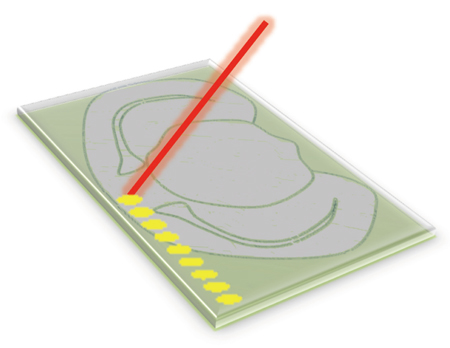
A tissue section is placed on an ITO-coated glass slide, and matrix solution is sprayed onto the surface.
A special target plate for thick specimens is available as an option. The specimen is moved beneath the focused laser beam to create a time dependent series of mass spectra where each time corresponds to a specific spatial location. Analysis of the data allows the researcher to visualize the spatial distribution of specific compounds on the sample surface. Mass spectrometry imaging data can be analyzed with the JEOL msMicroImager™ software or converted to a common data format imzML which allows data analysis by third party software such as BioMap.
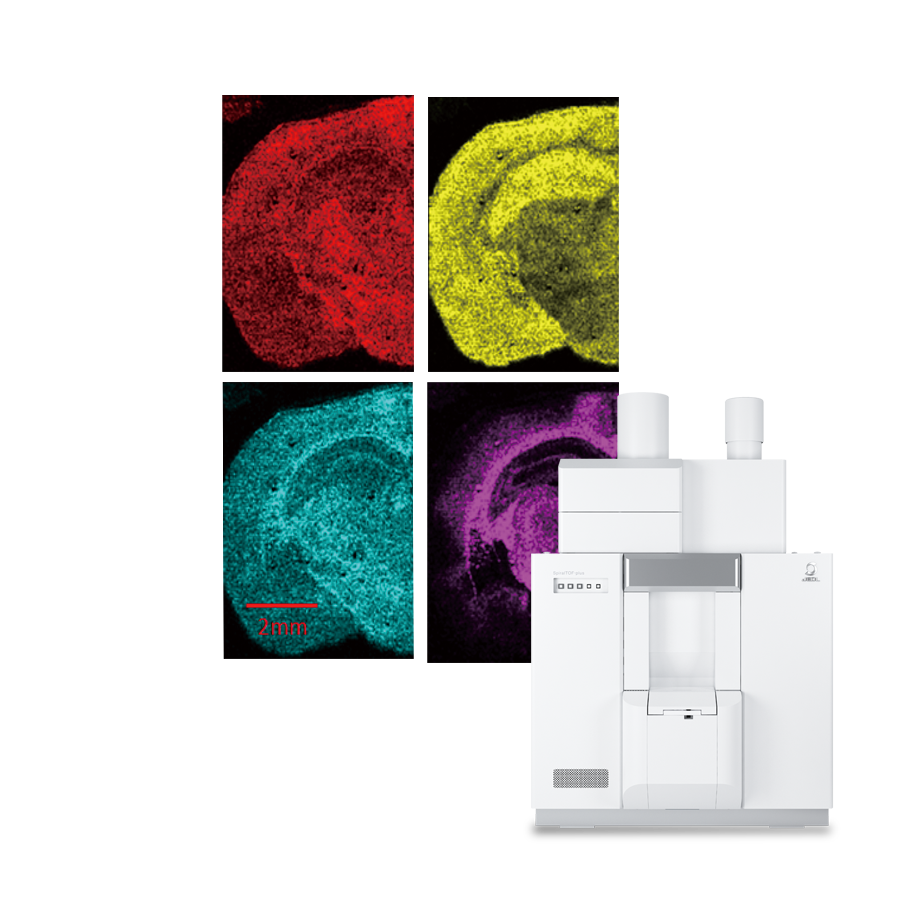
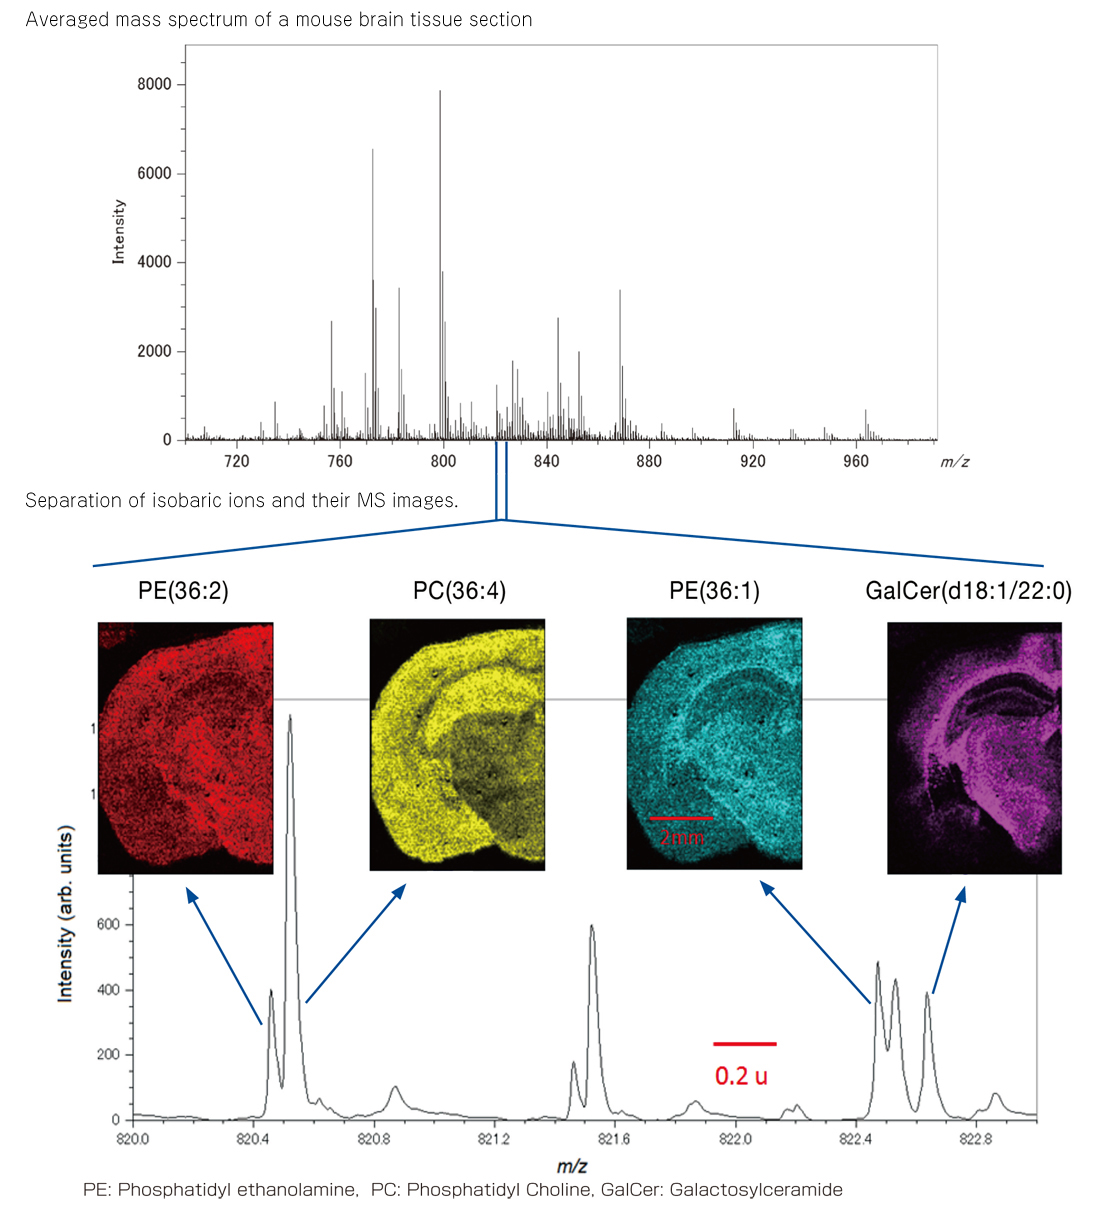
Mass Spectrometry Imaging Analysis of Lipids in Mouse Brain Tissue Section
Mouse brain sections contain a variety of lipid classes. A mass spectrum obtained from the tissue section is highly complex, especially in the region of m/z 700 - 1,000. Many of the peaks in the mass spectrum are less than 10% of the base peak, representing minor components. MALDI MS imaging of lipids requires a mass-resolving power high enough to separate the minor peaks from interferences. The bottom mass spectrum below shows the expansion of m/z 820 - 823. Many peaks were separated from each other by less than 0.1 u. The high mass resolving power of the SpiralTOF™-plus clearly separated these isobaric peaks, thus allowing the elucidation of 4 lipid elemental compositions. Moreover, each lipid clearly showed a different spatial distribution. Elucidation of elemental compositions and accurate determination of spatial distributions for each lipid would be difficult with a conventional reflectron TOFMS with moderate mass-resolving power.
The data were acquired in a joint research project with the Mass Spectrometry Group, Project Research Center for Fundamental Sciences, Graduate School of Science, Osaka University.
The tissue section specimen was provided by Awazu laboratory, Division of Sustainable Energy and Environmental Engineering, Graduate School of Engineering, Osaka University.
Statistical Analysis of Mass Spectrometry Imaging Data by using SCiLS Lab MVS
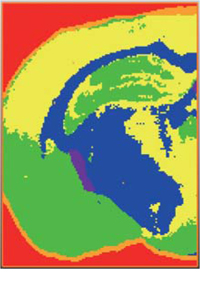
Advanced statistical data analysis was performed based on all of the mass spectral peaks detected in the data above by using SCiLS Lab MVS. Segmentation of the characteristic regions and extraction of the mass spectrum from each segment facilitated by the high mass-resolving power of the JMS-S3000 SpiralTOF™-plus have been achieved.
Result of pLSA (probabilistic latent semantic analysis)
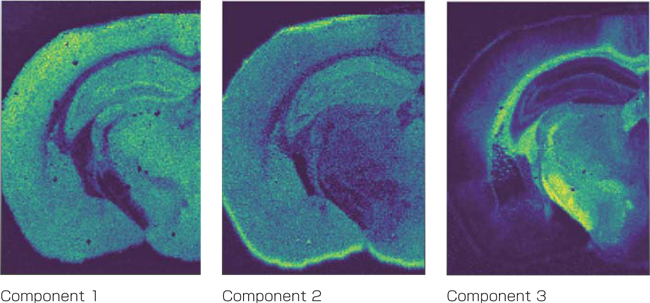
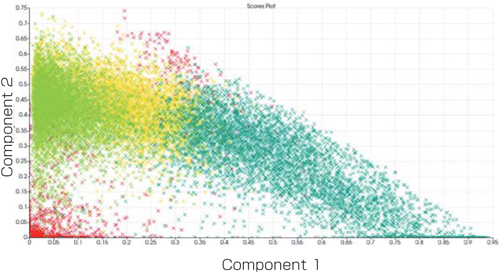
Relationship between pLSA score plot and Segmentation
Segmentation
Mass spectra from respective segments
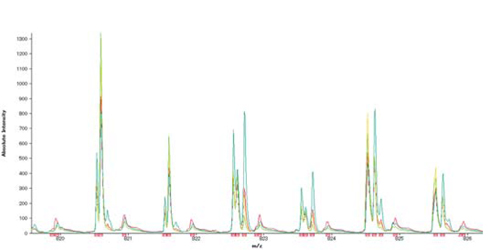
Analyzed with SCiLS Lab MVS, Version 2020b Premium3D
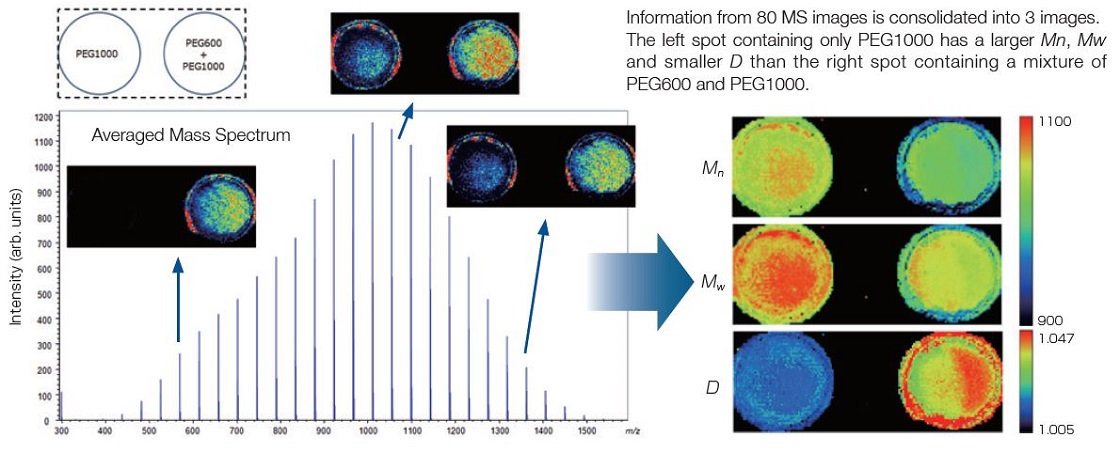
Mass spectrometry imaging data analysis of synthetic polymers by using msMicroImager™
In conventional MS imaging, a MS image is extracted by specifying a specific m/z range. However, since polymers are polydisperse and have molecular weight distributions, the conventional method can generate only a mass image of a specific degree of polymerization, and the spatial distribution of the polymer as a whole cannot be visualized. To solve this problem, msMicroImager™ can generate an image with the number average molecular weight (Mn), weight average molecular weight (Mw), and polydispersity (D) of the polymer. This makes it possible to visualize the spatial distribution of polymers more intuitively by consolidating hundreds of mass images derived from each degree of polymerization / isotope peak into three images.
MS Imaging of polyethylene glycols having different molecular weight distributions (MSTips No.305)
A conventional method can visualize the distribution of a polymer species with a specific degree of polymerization.
Mass Spectrometry Imaging Analysis of Polymers by Combining msMicroImager™ and msRepeatFinder
Specifications
Options
| Model name | Description | |
|---|---|---|
| Target plates | Sample plate holder | For ITO glass sample plate (Hudson Surface Technology) |
|
ITO glass sample plate, 0.7 mm thick, 25/package (Hudson Surface Technology; HST) |
||
| Multi-target plate | For thick specimens
Indentations for 0.5 mm thick and 1.0 mm thick specimens. |
|
| Software |
MS-56530MSI MS Imaging Support Program |
1D (line) scan and 2D scan (imaging) data acquisition. Convert MS imaging raw data into imzML format. |
|
msMicroImager™ MS-56550MSIV MS Imaging Viewer Program |
Read MS imaging raw data acquired by msTornado™ Control. Perform pixel binning. Extract and export MS images. Export mass spectra of the regions of interest. Browse MS images. Change color map of the images. Perform arithmetic operations between MS images. Overlay MS images. |
|
| BioMap | BioMap is developed and copyrighted by Novartis Institute for BioMedical Research (Basel, Switzerland) and available from the MALDI Mass Spectrometry Imaging Interest Group (MALDI MSI IG) web site. |
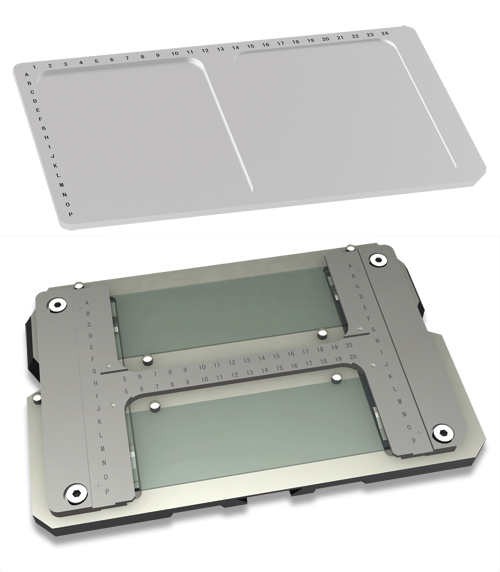
Top: multi-target plate for thick specimens (for 0.5 mm thick and 1.0 mm thick specimens)
Bottom: sample plate holder for ITO (indium tin oxide) coated glass slide by Hudson Surface Technology
Catalogue Download
JMS-S3000 SpiralTOF™-plus 2.0 Mass Spectrometry Imaging System
Application
Application MS-Imaging
JMS-S3000 SpiralTOF™ series Imaging Applications Notebook
JMS-S3000 SpiralTOF™ series Life Science Applications Notebook
JMS-S3000 SpiralTOF™ series Polymers, Materials, & Chemistry Applications Notebook
JMS-S3000 SpiralTOF™ series Shared Instrument Applications Notebook
Workflow for Molecular Structure Analysis of Transition Metal Complexes
Comprehensive Analysis of Acetylacetonate Complexes
Molecular Structure Analysis of Alkaloids
Molecular Structure Analysis of Organic Compounds used in Agricultural and Food Chemistry
MALDI Application: Structural analysis of EO-PO copolymers using high-resolution MALDI-TOFMS and NMR
JMS-S3000 SpiralTOF™ Imaging Applications Notebook, Edition May 2016

Applications Notebook for the MS imaging applications of JMS-S3000 SpiralTOF Matrix-Assisted Laser Desorption/Ionization - Time-of-Flight Mass Spectrometer (MALDI-TOFMS). Including the JMS-S3000 SpiralTOF bibliography as of May 2016.
Related Products
Related Products
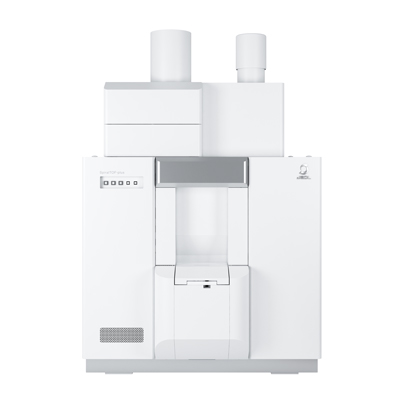
MALDI: JMS-S3000 SpiralTOF™-plus 2.0 Matrix-Assisted Laser Desorption/Ionization Time-of-Flight Mass Spectrometer
The JMS-S3000 is a MALDI-TOFMS* that incorporates the innovative SpiralTOF ion optics.The JMS-S3000 has evolved into SpiralTOF™-plus 2.0 with much wider dynamic range. The JMS-S3000 defines a new standard in MALDI-TOFMS performance and provides state-of-the-art analytical solutions for a wide range of research areas such as functional synthetic polymers, materials science, and biomolecules.
◆ Clicking the Play button starts the video (approx. 4 minutes).
Matrix-Assisted Laser Desorption/Ionization Time-of-Flight Mass Spectrometer
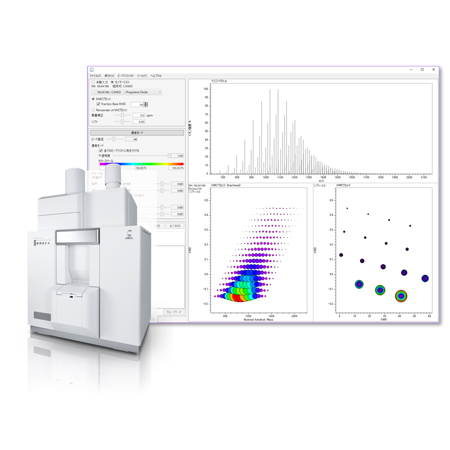
msRepeatFinder Polymer Analysis Software
Definitive Polymer Analysis Software !!
Visualizes complicated mass spectral data and accelerates information sharing !
More Info
Are you a medical professional or personnel engaged in medical care?
No
Please be reminded that these pages are not intended to provide the general public with information about the products.